Automate and scale manual testing with AI.
TestDriver reduces manual testing costs by 94% while performing tasks 3× faster than human-powered testing.
Test anything you can run on a computer.

- Elements Tested with AI
- 5M+
- Hours Automated
- 25K+
- Test Cases Created
- 30K+
- Test Runs Executed
- 312K+
See it in action
Watch how TestDriver automates complex user flows across different platforms with AI-powered precision.
Works everywhere
Test anything a user can do
TestDriver interacts with software visually, so it works anywhere selector-based tools fail.
- Third-party web apps.
- Test apps you don't own or control without access to source code.
- Chrome extensions.
- Browser extensions with popups, content scripts, and background pages.
- Desktop apps.
- Native Windows and macOS applications with full interaction support.
- VS Code extensions.
- Test your editor extensions in real development environments.
- Rich media & embedded content.
- Canvas, video players, images, iFrames, and OAuth flows that break selector-based tools.
- Documents & AI content.
- File uploads, PDFs, LLM chatbots, and spelling & grammar validation.
How it works
Durable tests. No selectors.
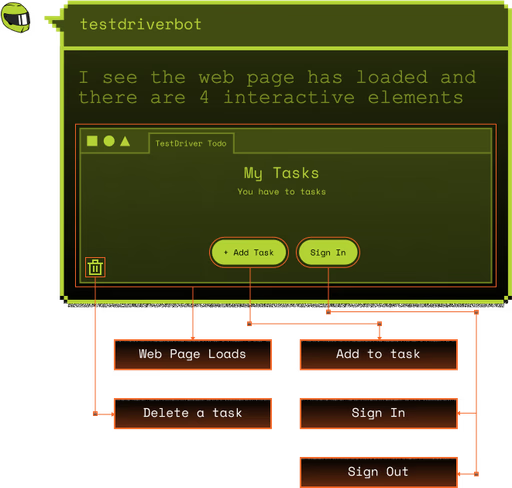
TestDriver watches your app run, generates tests with MCP, adapts when the UI changes, and reports what breaks.
Generate tests with MCP
TestDriver uses MCP to explore your app, understand its UI, and generate test files as real user flows. Describe what you want to test in natural language and TestDriver writes the code.
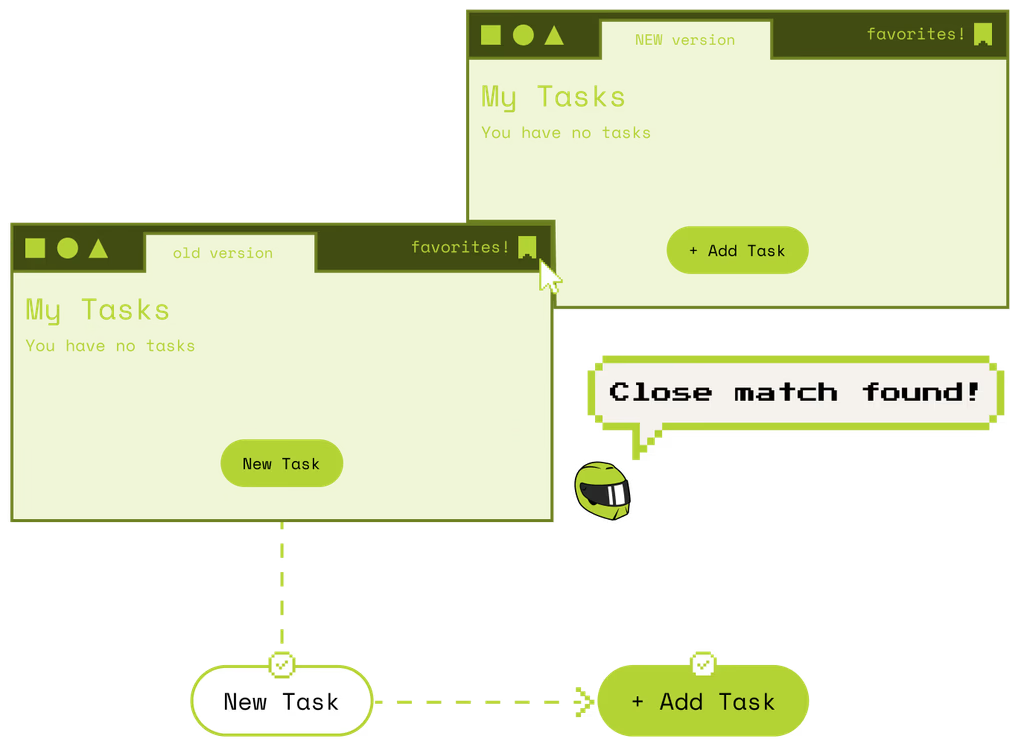
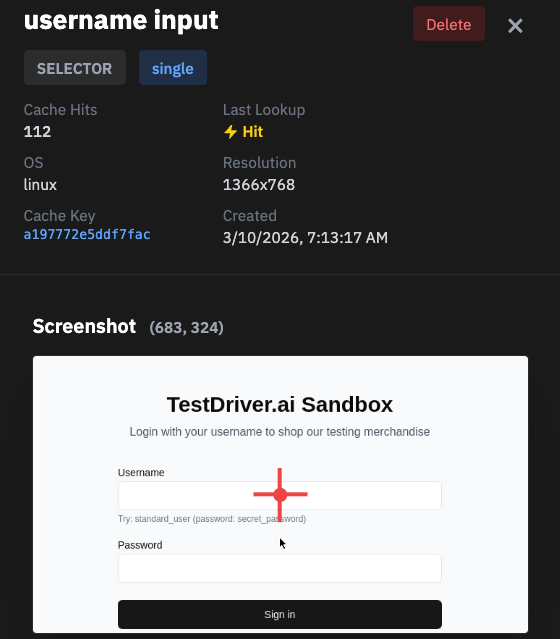
Cache and Adapt
TestDriver caches a vision-derived representation of your UI so repeat runs are fast—no AI calls needed when the screen looks the same. When the UI changes, it automatically re-invokes the AI to find elements, update its understanding, and keep tests passing.
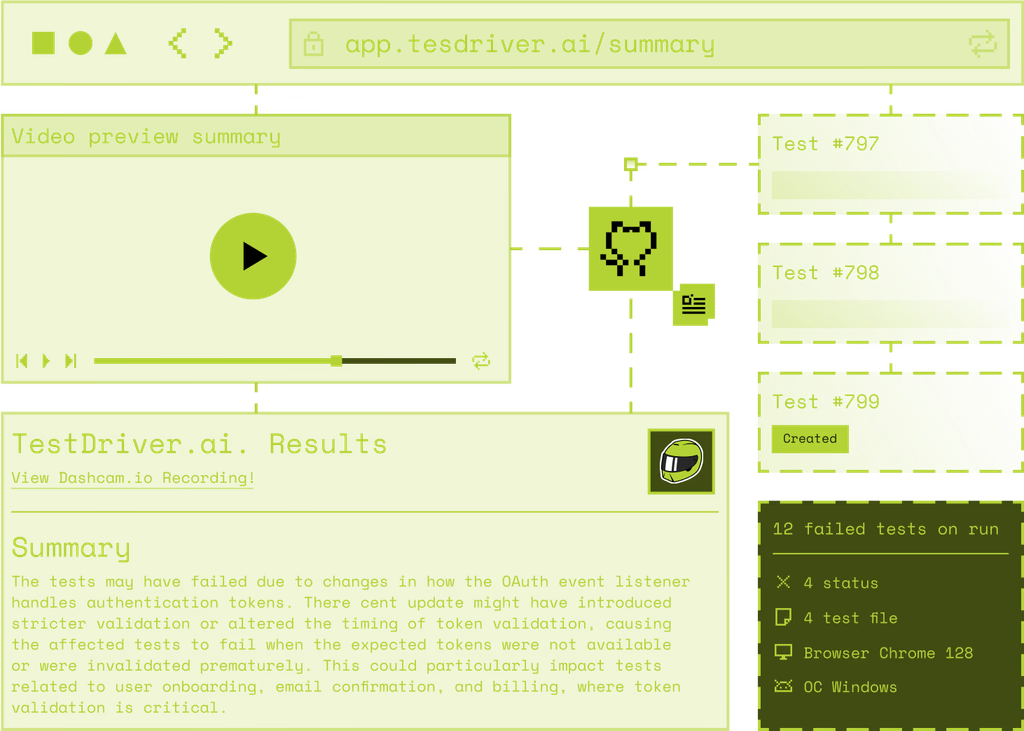
Test every pull request
Run your full test suite on every PR so nothing merges without passing. Results post directly to GitHub with video, logs, and JUnit XML—reviewers see exactly what passed and what broke.
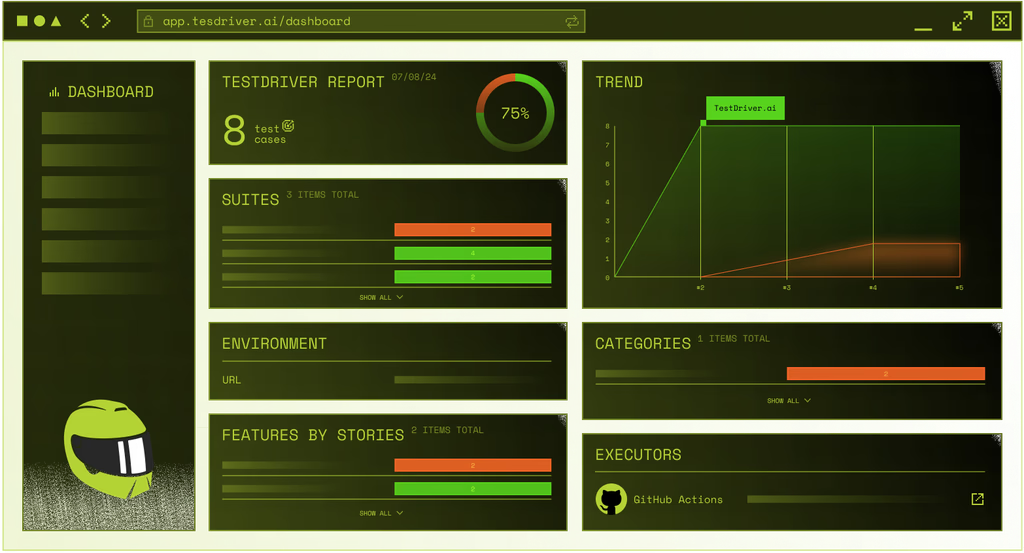
Find bugs and reveal trends
The TestDriver console gives you a dashboard with analytics across every test run—pass rates, failure patterns, flaky tests, and trends over time. Watch video replays, inspect logs, and drill into regressions without leaving the browser. Need to plug into your existing CI? Export results as JUnit XML for any reporter or artifact pipeline.
Console
Everything you need to manage your tests
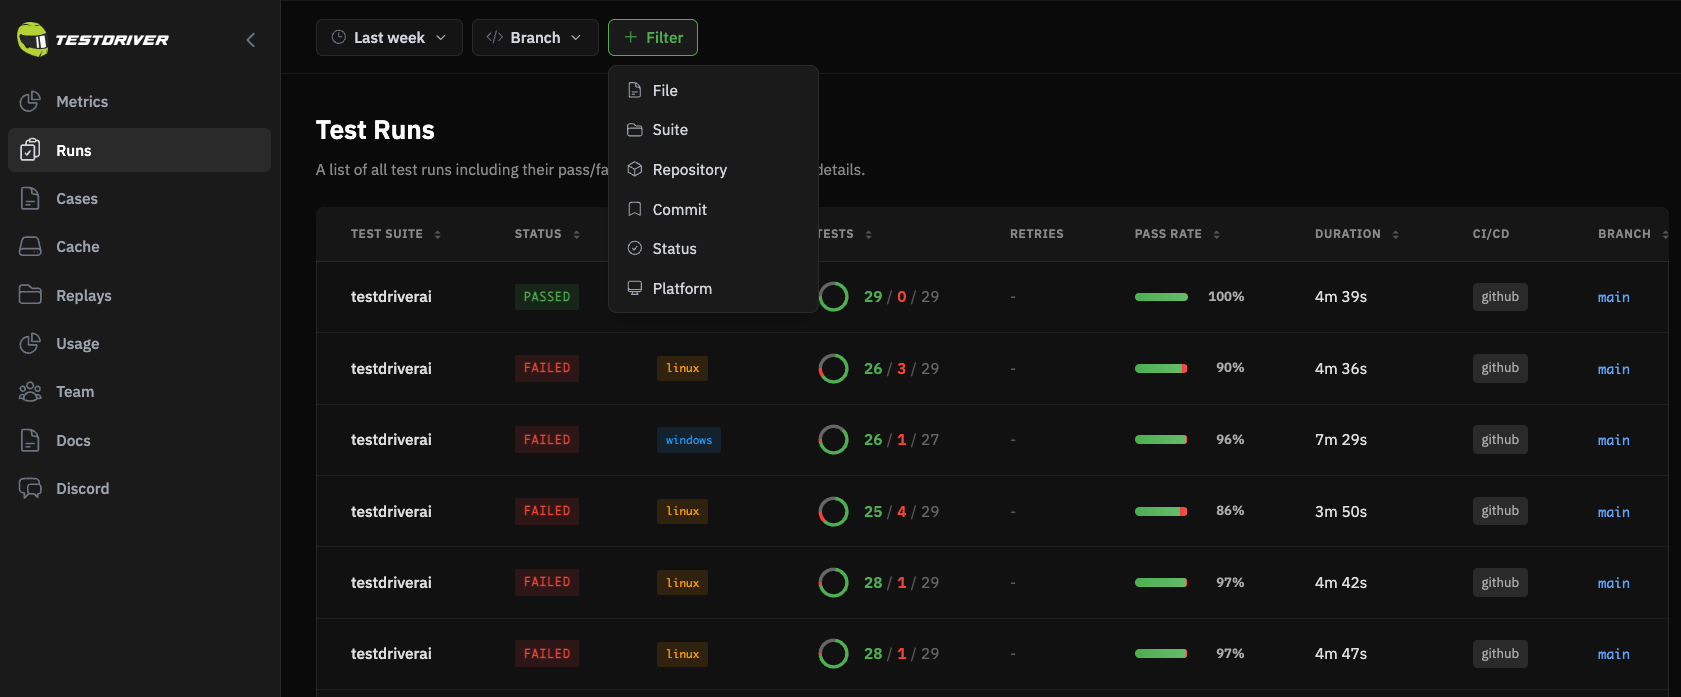
Test Runs
Monitor every run at a glance
See the status of all your test runs in one place. Quickly identify failures, track pass rates, and drill into individual results.
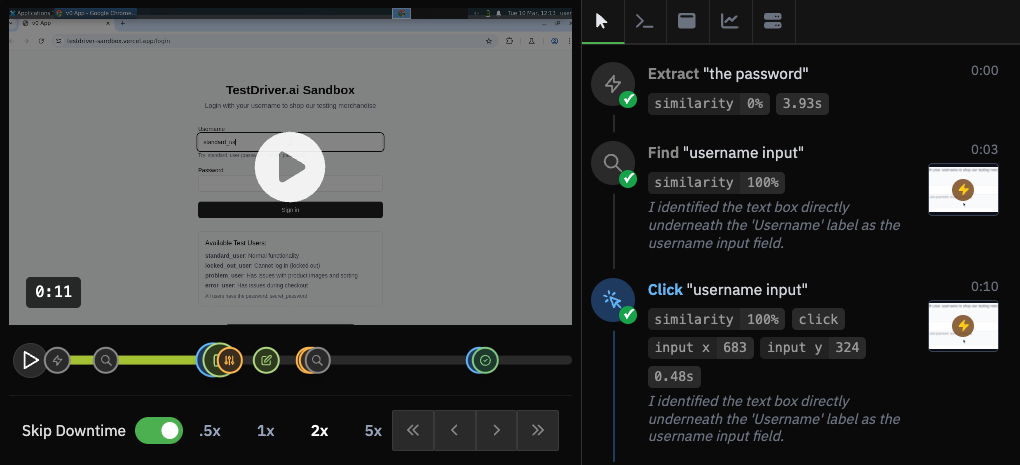
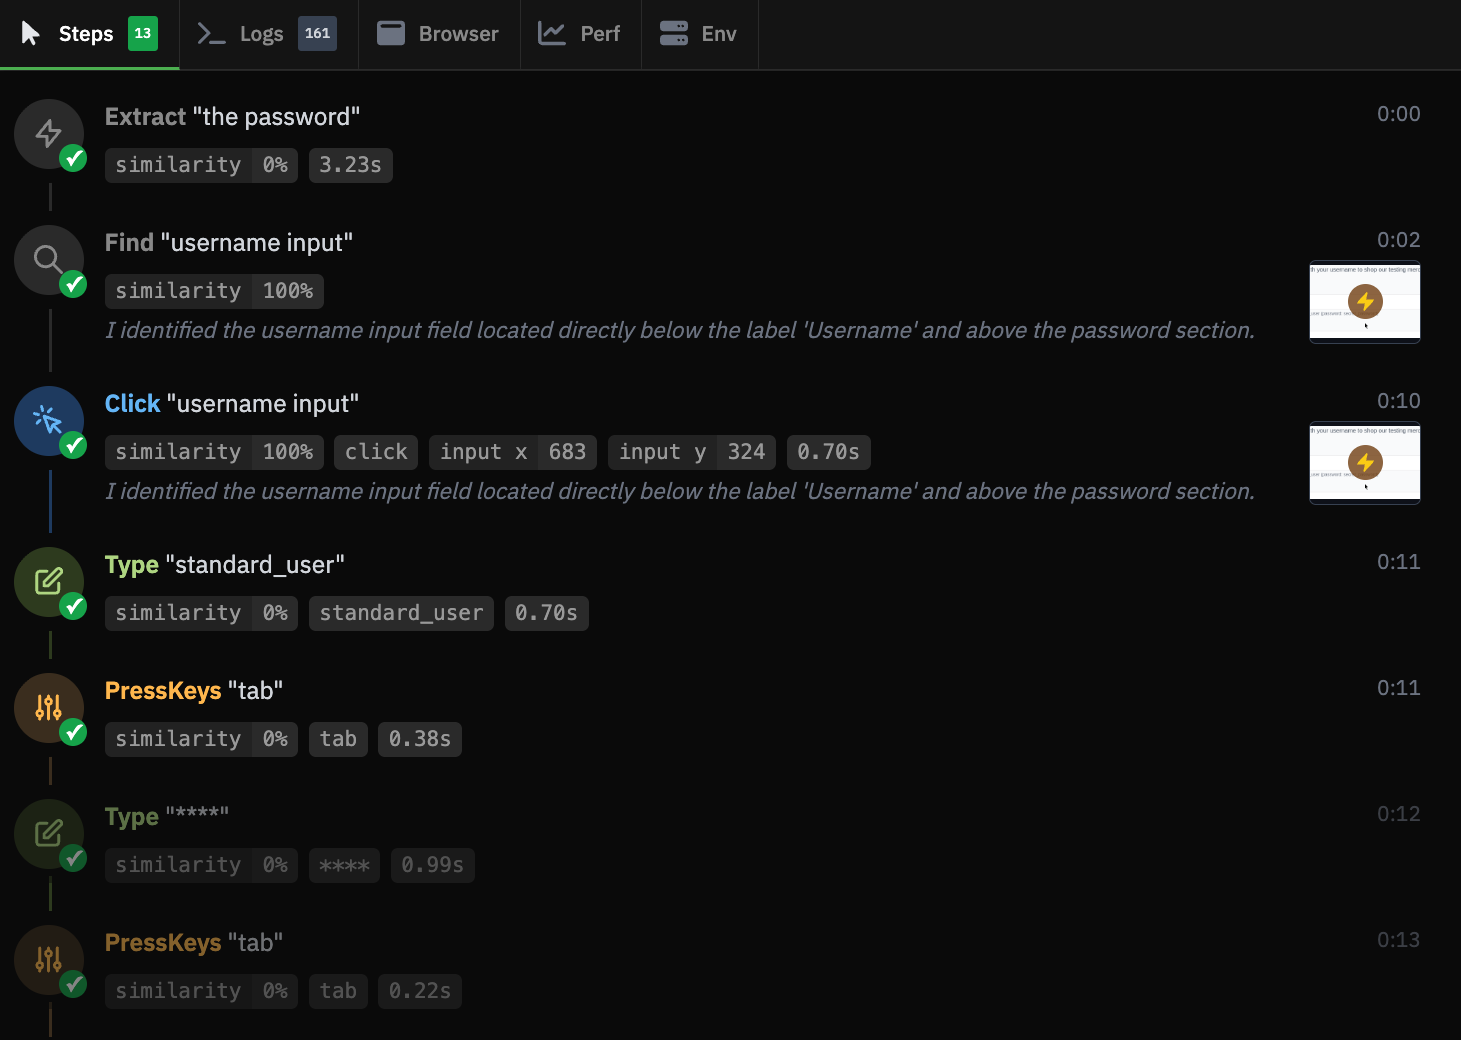
Playback
Watch tests as they happened
Replay test executions step by step to understand exactly what occurred during each run.
Cache
Speed up repeated tests
Manage cached assets and responses to accelerate test execution without sacrificing accuracy.
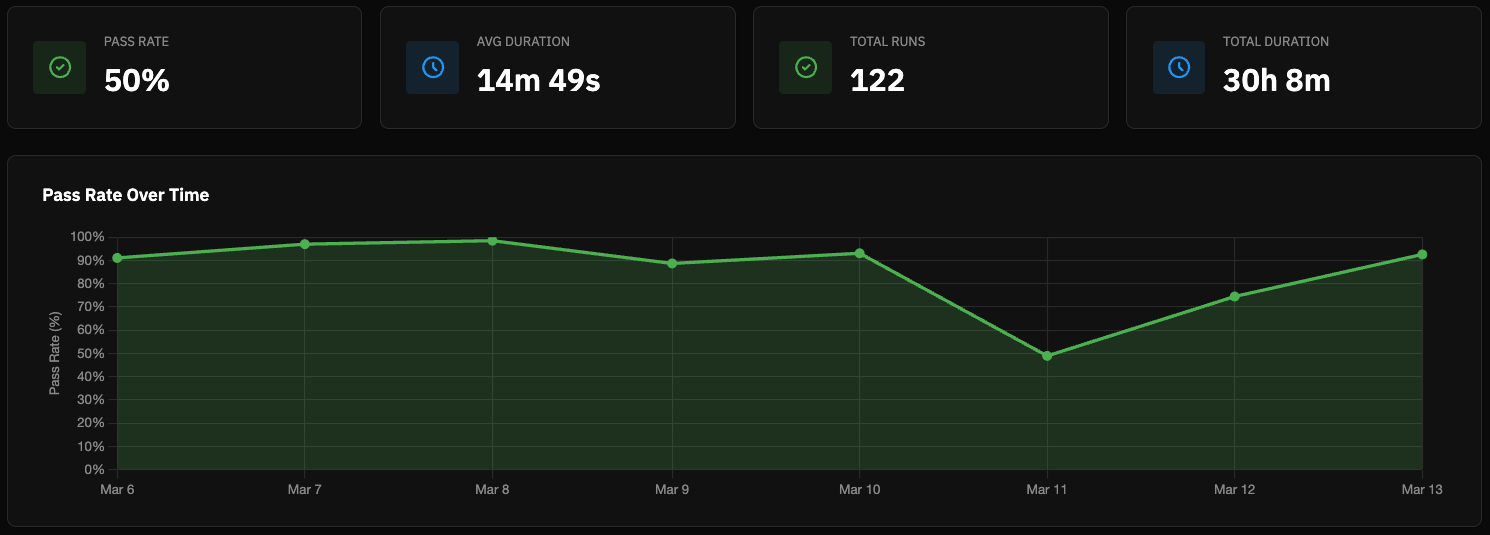
Trends
Track reliability over time
Visualize pass rates, flakiness, and performance trends to keep your test suite healthy and improving.
Debugging
Deep visibility into every test
Request Info
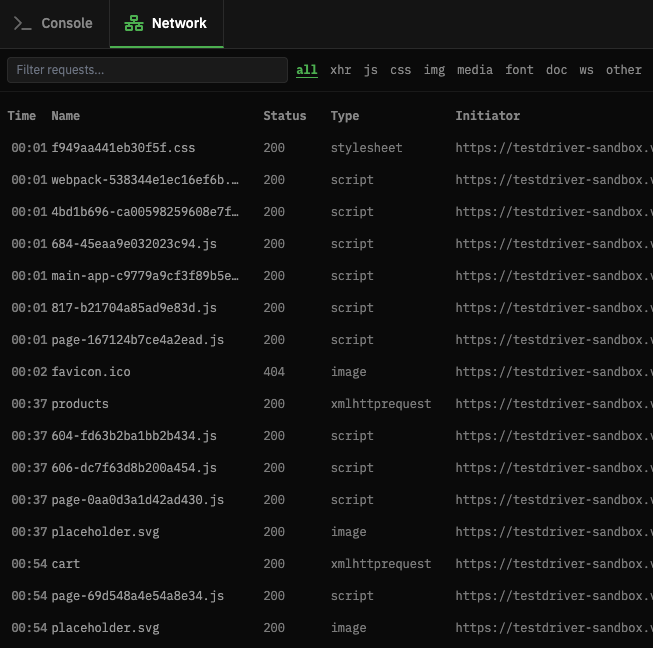
Inspect every network call
Examine HTTP requests and responses in detail. See headers, payloads, and timing to quickly diagnose API issues and failed interactions.
Request Info
Inspect every network call
Examine HTTP requests and responses in detail. See headers, payloads, and timing to quickly diagnose API issues and failed interactions.
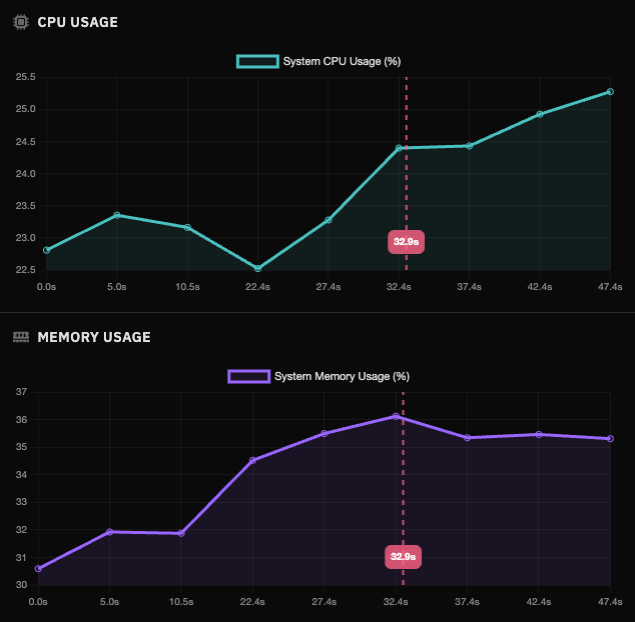
CPU & Memory
Performance at a glance
Monitor resource usage during test execution to catch memory leaks and performance bottlenecks.
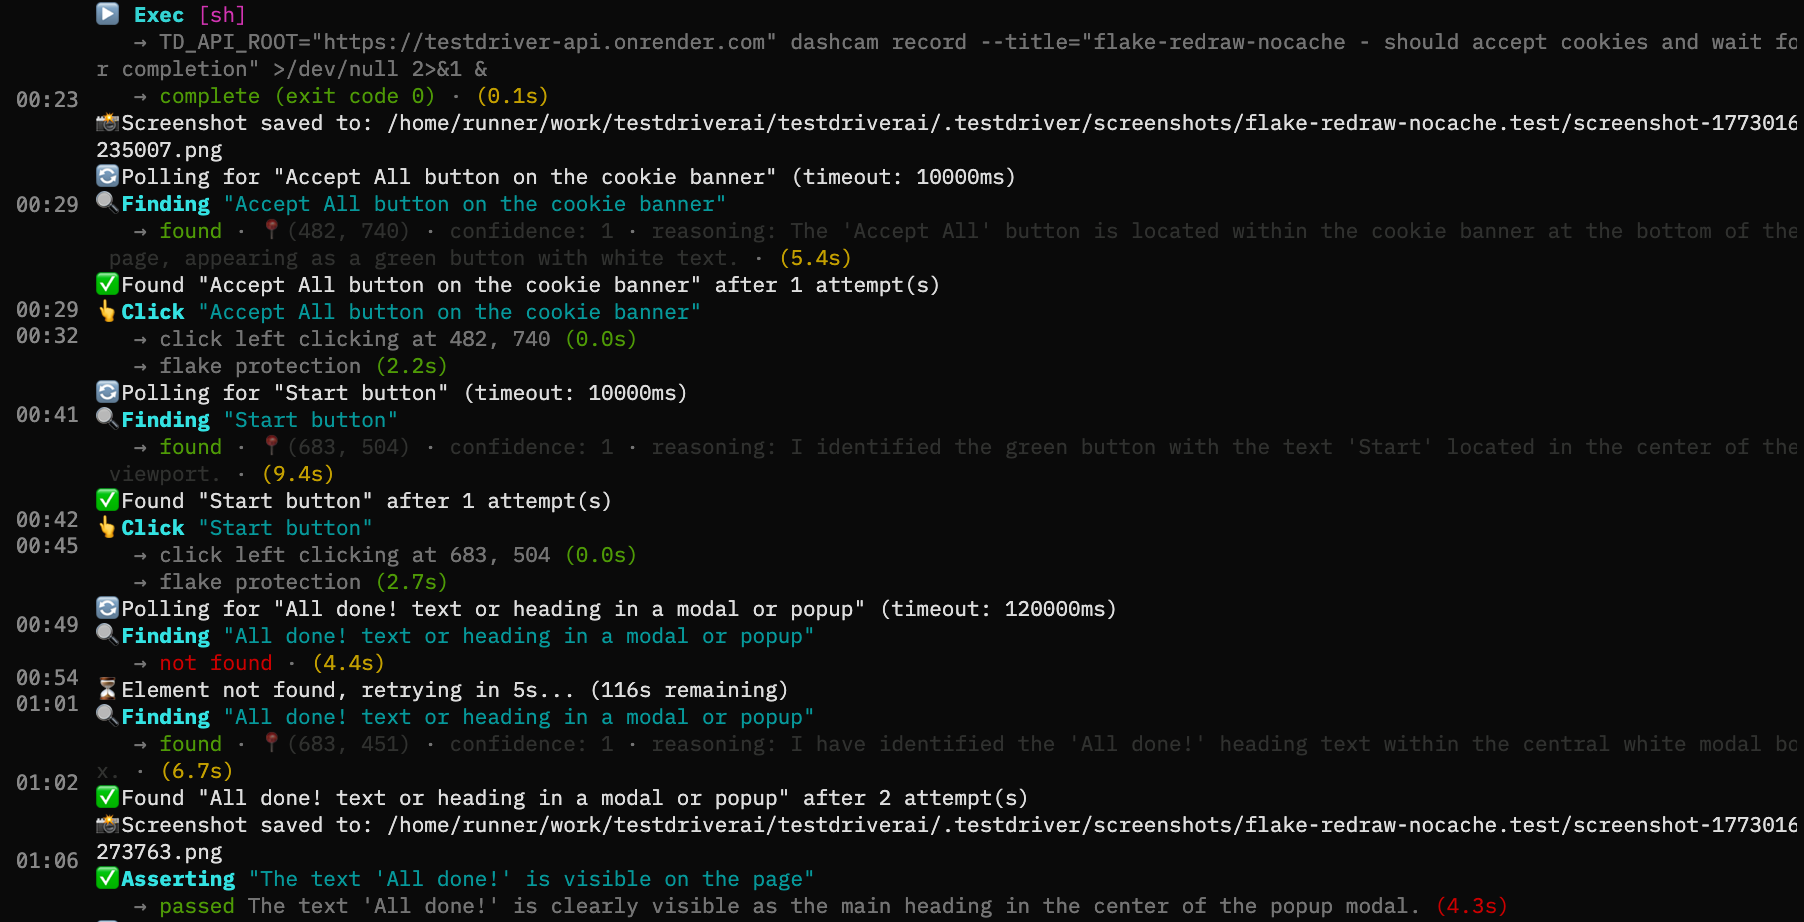
Action Log
Step-by-step execution history
Follow the complete timeline of every click, input, and assertion. Pinpoint exactly where tests diverge from expected behavior.
Trusted by leading engineering teams


Pricing
Way less expensive than manual testing.
Start free and upgrade for more platforms and parallel tests.
Free Cloud
$0
No Credit Card Required.
Start For FreeTry TestDriver free, no credit card required.
- 1 Team User
- Includes 60 Minutes
- Community Support
Desktop Targets
Mobile Targets
Desktop Platforms
Pro Cloud
$20/month
Plus Per-Second Overage.
Save 71% vs manual testing
SubscribeInstall and start testing today.
- 1 Team User
- Includes 600 Minutes
- Overage billed at $0.002/second
- Test Recordings
- Community Support
Desktop Targets
Mobile Targets
Desktop Platforms
Team Cloud
$600/month
Plus Per-Second Overage.
Save 86% vs manual testing
SubscribeFor production QA automation at scale.
- 5 Team Users
- Includes 10,000 Minutes
- Overage billed at $0.001/second
- Test Recordings
- Private Support
- Test Analytics
- CPU, RAM, & Network Profiles
Desktop Targets
Mobile Targets
Desktop Platforms
Enterprise Self-Hosted
Contact Us
Licensed Based Billing
Save 94% vs manual testing
Contact UsFor production QA automation at scale.
- Custom Team Size
- Unlimited Minutes
- No Overage Charges
- Test Recordings
- Enterprise Support
- Test Analytics
- CPU, RAM, & Network Profiles
- Custom VM Images
Desktop Targets
Mobile Targets
Desktop Platforms