Unlocking Software Quality with Test Metrics in Testing
Discover the essential test metrics in testing that drive quality and accelerate releases. Learn to measure what matters for your QA and development teams.
Automate and scale manual testing with AI ->
Test metrics are simply the numbers that tell you the story of your software’s quality. They’re the hard data that show how effective your testing is, how healthy your codebase is, and whether you’re actually ready to ship. It’s like the old saying goes: if you can’t measure it, you can’t improve it.
Why Test Metrics Are Your Team’s GPS for Quality
Shipping a new feature without data is a bit like driving in a new city without a map. There’s that familiar knot of anxiety many engineering teams feel right before a release—a feeling that you’re relying more on hope and gut feelings than on solid signals. It’s a risky way to work, leaving quality to chance and making it impossible to know if you’re about to delight users or unleash a flood of new bugs.
This is exactly where test metrics come in. They aren’t just abstract numbers on a dashboard; they’re your team’s GPS for navigating software quality. These quantifiable signals tell you what’s really going on with your application and your testing, answering the questions that keep you up at night:
- Is our software stable enough for release?
- Are we finding bugs before our customers do?
- Which parts of our app are the riskiest?
- Is our testing actually getting better and faster?
From Guesswork to Data-Driven Decisions
When you start tracking the right numbers, you can finally move from reactive firefighting to proactive quality management. These metrics give everyone—QA engineers, developers, and product managers—the information they need to make smart, data-driven decisions. Instead of arguing about release readiness based on feelings, you can point to a low defect escape rate or a high test pass rate as real proof of stability.
Test metrics turn fuzzy concepts like “quality” and “readiness” into concrete numbers that the whole team can understand and act on. That shared understanding is key to building a collective sense of ownership over the product.
Modern tools have completely changed the game, making it much easier to collect and make sense of these signals. Platforms like TestDriver plug right into your workflow, automatically gathering data and serving it up in intuitive dashboards. This means any team, big or small, can start being more strategic about quality.
Building this mindset is the first step. You can learn more about how to build a healthy metrics culture in your organization to get everyone on board. In the end, test metrics give you the confidence to ship better software, faster.
The Seven Essential Metrics Every QA Team Should Master
If you want to improve software quality, you have to move beyond gut feelings and start listening to the data. But with dozens of potential metrics out there, it’s easy to get lost in a sea of numbers. The trick is to focus on a handful of metrics that give you the clearest signal about your product’s health and your team’s efficiency.
Think of these seven core metrics as your diagnostic toolkit. They don’t just tell you what happened; they help you uncover why it happened and guide you on what to do next. Mastering them is what separates teams that are always reacting to problems from those that proactively build quality into their software from day one.
This is all about making the fundamental shift from guesswork to data-driven decision-making.
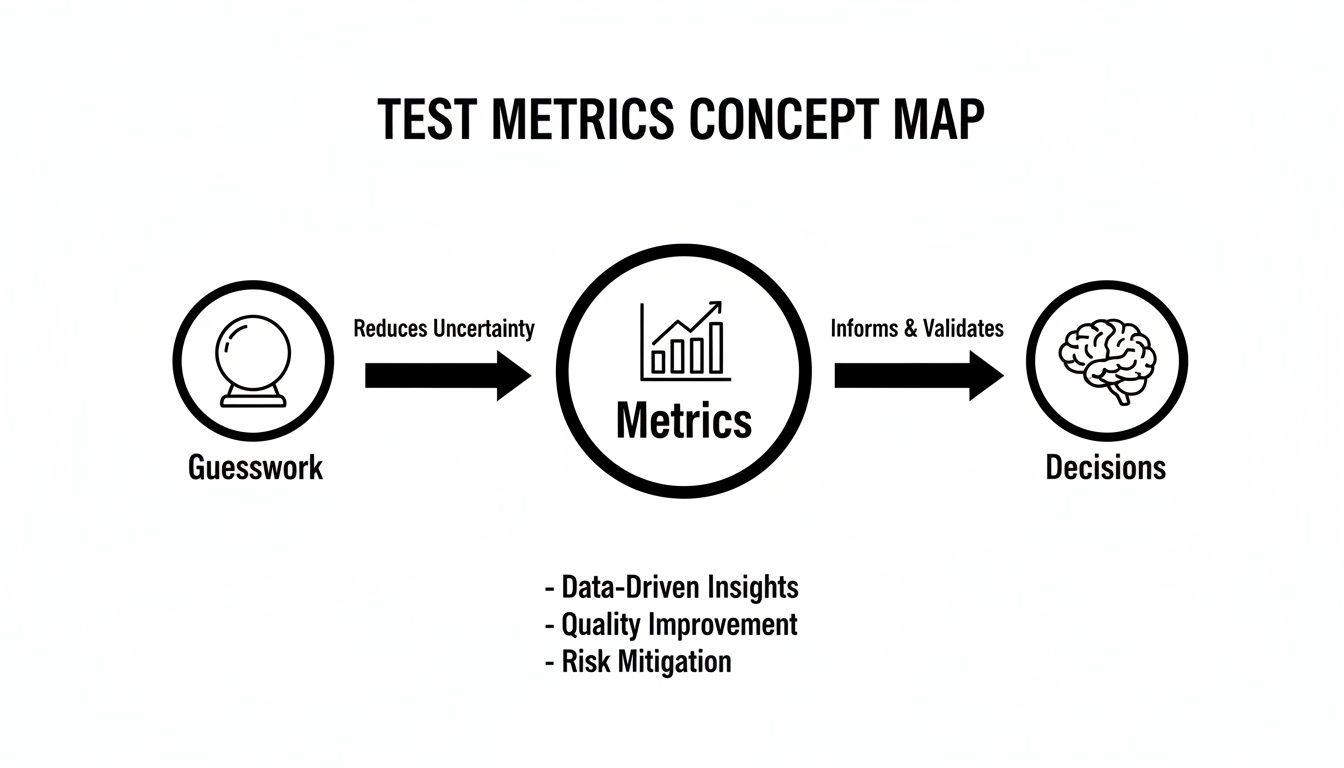
As you can see, structured data is the bridge that takes us from uncertainty to clear, strategic action in quality assurance.
To get you started, here is a quick overview of the key metrics we’ll be diving into.
Essential Test Metrics at a Glance
This table serves as a quick-reference guide to the seven metrics every quality-focused team should have on their dashboard.
| Metric Name | What It Measures | Ideal Target |
|---|---|---|
| Test Pass Rate | The percentage of tests that passed in a given run. | > 95% |
| Test Flakiness | The inconsistency of a test passing and failing without code changes. | < 1-2% per test |
| Test Coverage | The percentage of your codebase executed by tests. | > 80% for critical modules |
| MTTR | The average time it takes to restore service after a failure. | < 1 hour |
| Defect Escape Rate | The percentage of bugs found by users instead of your team. | < 5% |
| Test Execution Time | The total time it takes for a test suite to run. | < 10 minutes for CI |
| Testing ROI | The business value generated by your testing efforts. | Consistently positive |
Now, let’s break down each of these in more detail.
1. Test Pass Rate
The Test Pass Rate is your most immediate health check for any given build. It’s a straightforward percentage of how many automated tests passed during a run, giving you a quick thumbs-up or thumbs-down on the latest code changes.
- Formula:
(Number of Passed Tests / Total Number of Executed Tests) * 100 - Example: If your CI pipeline runs 500 tests and 485 pass, your Test Pass Rate is 97%.
- What it Signals: A consistently high pass rate (think >95%) suggests a stable application. When that number suddenly drops, it’s a huge red flag that a major regression just landed in the codebase and needs immediate attention.
Honestly, it’s like the heartbeat monitor for your application. When the line is steady and high, everything is calm. A sudden plunge means it’s an all-hands-on-deck emergency.
2. Test Flakiness
We’ve all seen them: flaky tests. They pass, then they fail, then they pass again—all without a single change to the code. These are more than just an annoyance; they’re incredibly destructive because they erode your team’s trust in the entire test suite, leading engineers to ignore legitimate failures.
Tracking test flakiness is absolutely essential for maintaining a reliable automation pipeline.
A flaky test is worse than no test at all. It injects uncertainty and noise into your CI/CD pipeline, conditioning your team to ignore red flags.
- Formula:
(Number of Times a Test Fails Inconsistently / Total Number of Test Runs) * 100 - Example: A specific login test runs 100 times. It passes 90 times but fails 10 times for no apparent reason. Its flakiness rate is 10%.
- What it Signals: A flakiness rate above 1-2% for any individual test is a major problem. It usually points to underlying issues with test data management, environmental instability, or tricky asynchronous code that needs to be handled more carefully.
3. Test Coverage
Test Coverage tells you how much of your application’s code is actually being exercised by your test suite. But a word of caution: chasing a 100% coverage score is a fool’s errand. The real value isn’t just how much code is covered, but what code is covered.
A much smarter approach is to focus on risk-weighted coverage. This means you pour your energy into ensuring that your most critical business logic and high-traffic user flows are tested inside and out.
- Formula:
(Lines of Code Executed by Tests / Total Lines of Code) * 100 - Example: Your payment module has 1,000 lines of code. Your tests execute 850 of those lines. Your code coverage for that module is 85%.
- What it Signals: Low coverage in a critical area is a disaster waiting to happen. You should aim for high coverage (>80%) in business-critical components while being comfortable with lower coverage in less important parts of the app.
4. Mean Time To Recovery (MTTR)
When a failure inevitably happens in production, the only thing that matters is how fast you can fix it. Mean Time To Recovery (MTTR) measures the average time it takes your team to restore service after an outage or critical bug is discovered.
This metric is a direct reflection of your team’s operational readiness and the overall resilience of your system.
- Formula:
Total Downtime from Incidents / Number of Incidents - Example: Your app had three outages last quarter with downtimes of 30, 45, and 15 minutes. Your MTTR is (30 + 45 + 15) / 3 = 30 minutes.
- What it Signals: A low MTTR is proof that you have effective monitoring, sharp alerting, and a smooth deployment process. The truly elite DevOps teams often boast an MTTR of less than one hour.
5. Defect Escape Rate
This might be the single most important metric for gauging your entire QA process. The Defect Escape Rate tells you what percentage of bugs were found by your customers in production instead of by your team before the release. It’s a humbling but necessary reality check.
- Formula:
(Bugs Found in Production / (Bugs Found in Pre-Production + Bugs Found in Production)) * 100 - Example: Your QA team finds 90 bugs during a sprint. After the release, customers report 10 new bugs. Your Defect Escape Rate is (10 / (90 + 10)) * 100 = 10%.
- What it Signals: A high rate points to significant gaps in your testing strategy. An industry benchmark for a mature team is a Defect Escape Rate below 5%. If you want to dig into this further, you can explore other key metrics to track in quality engineering environments.
6. Test Execution Time
How long does it take to get feedback from your automated tests? Test Execution Time measures the total duration of a test suite run. This is absolutely critical for maintaining a fast development cycle—nobody wants to wait around for an hour to find out if their commit broke the build.
And since app performance is so vital, a big part of this is understanding and optimizing app performance under all sorts of conditions.
- Formula:
End Time of Test Suite Run - Start Time of Test Suite Run - Example: Your full regression suite kicks off at 2:00 PM and finishes at 2:15 PM. The execution time is 15 minutes.
- What it Signals: For builds running in your main CI pipeline, the execution time should ideally be under 10 minutes. If it starts creeping up, it’s a sign that you need to start parallelizing your tests or hunting down and optimizing the slow ones.
7. Testing ROI
Finally, we need to connect all this hard work back to business value. Testing ROI (Return on Investment) helps you justify your team’s budget and resources by estimating the money you’re saving the company by catching bugs early.
Sure, calculating this requires a bit of estimation, but the exercise itself is incredibly valuable for framing the conversation with leadership.
- Formula:
(Cost of Fixing Bugs in Production - Cost of Finding and Fixing Bugs in Testing) / Cost of Testing - Example: Let’s say the average production bug costs $5,000 to fix (dev time, support calls, customer impact). Finding it early in testing only costs $500. Your total testing budget was $20,000, and you found 90 bugs. Your ROI is (($5,000 * 90) - ($500 * 90)) / $20,000 = 20.25, or a whopping 2,025%.
- What it Signals: A positive ROI is clear proof that your QA efforts aren’t just a cost center—they are actively saving the company money and protecting its reputation.
Bringing Your Test Data to Life with Dashboards
Collecting data is just the first step. Raw numbers like pass rates and defect counts are useful, but on their own, they don’t tell the full story. The real magic happens when you weave those isolated data points into a clear, visual narrative that everyone on your team can understand in a glance.
This is where QA dashboards come in. A well-designed dashboard transforms your test metrics in testing from a static spreadsheet into a dynamic, living picture of your release health. It’s the difference between reading a dense report and seeing the entire story unfold on a single screen.
Instead of just spitting out numbers, a great dashboard provides context. It shows you trends over time, flags strange anomalies, and helps you connect the dots between different metrics to see the bigger picture of your software quality.
Designing Dashboards That Tell a Story
An effective dashboard isn’t a data dump; it’s a carefully curated story. Every chart and graph should answer a specific question about your quality process, helping your team jump from observation to action.
Here are a few practical examples of how to visualize key metrics:
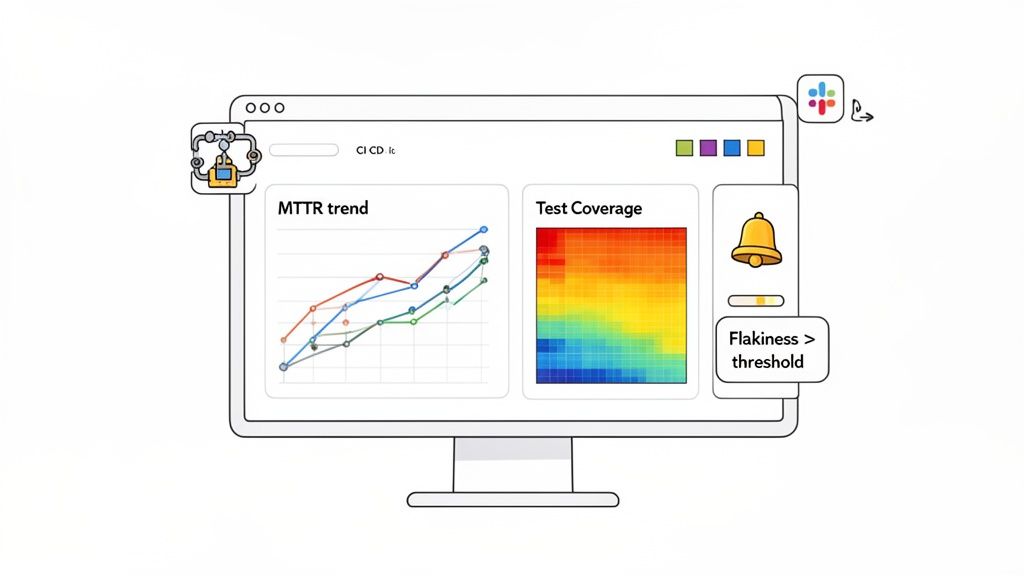
- MTTR Trend Line Chart: Don’t just show today’s Mean Time To Recovery. Plot it on a line chart over the last three months. This immediately reveals if your incident response is getting faster or slower, sparking conversations about what process changes are actually working.
- Test Coverage Heat Map: A simple 85% coverage number doesn’t tell you where that coverage is. A heat map can overlay your application’s modules with colors representing test density. It instantly draws everyone’s eyes to critical, under-tested areas.
- Flakiness Leaderboard: Create a simple table listing the top five flakiest tests. This almost gamified approach encourages the team to finally tackle those problem tests and improve the reliability of the entire CI pipeline.
These visualizations make complex data digestible for everyone—from engineers hunting for specific bugs to managers needing a high-level pulse on release readiness.
Your dashboard should be an early warning system, not a historical archive. The goal is to surface problems before they become catastrophes, giving your team the chance to be proactive instead of reactive.
This shift from hindsight to foresight is what it’s all about. When dashboards are plugged directly into your CI/CD pipeline, they give you real-time visibility and kill those dreaded last-minute surprises right before a deployment.
Automating Your Alerts for Proactive Quality
A dashboard is powerful, but you can’t stare at it all day. The next logical step is to set up automated alerts that act as your team’s intelligent watchdogs. These alerts push critical information to your team exactly when they need it, turning your metrics into immediate, actionable signals.
Think about the impact of setting up alerts like these:
- Critical Flakiness Alert: If test flakiness on the
mainbranch jumps above 2%, an automatic notification hits your team’s Slack channel. An engineer can jump on it immediately before that one unreliable test derails everyone else. - Execution Time Threshold Breach: If the CI test suite execution time blows past its 12-minute budget, a PagerDuty alert is triggered for the on-call developer. This stops slow tests from grinding the entire development pipeline to a halt.
- Defect Escape Rate Spike: If the number of production bugs reported in a week doubles, an email summary is sent to engineering leadership. This prompts a strategic discussion about improving pre-release testing during the next planning meeting.
Modern tools can automate this entire process. By integrating a testing platform like TestDriver with your CI system and communication tools, you create a seamless feedback loop. This gives every stakeholder the real-time visibility they need and empowers your team to maintain a high quality bar without constant manual check-ins.
Improving Quality with Defect Removal Efficiency
Some metrics track how fast your pipeline runs or how stable your code is, but Defect Removal Efficiency (DRE) cuts right to the chase: how good are we at finding bugs before our customers do? Think of it as your quality team’s batting average.
A high DRE isn’t just a number to make a manager happy. It’s a clear signal that your entire testing strategy—from the smallest unit tests to the most complex end-to-end scenarios—is actually working. Catching bugs early builds a better product, sure, but it also builds a more confident, forward-thinking development team.
This metric is one of the most vital test metrics in testing because it draws a straight line from your team’s work to the end-user’s happiness.
Calculating Your Defect Removal Efficiency
To figure out your DRE, you need a simple, honest comparison: how many bugs did we find internally versus how many slipped past us and were found by users?
Here’s the formula:
DRE = (Defects Found Internally / (Defects Found Internally + Defects Found by Users)) * 100
Let’s walk through an example. Say your team squashed 95 bugs during a sprint. After the release, customers reported 5 more bugs that nobody caught. Your DRE would be (95 / (95 + 5)) * 100, which lands you at 95%. That’s a solid score and shows your testing process is catching almost everything.
Why a High DRE Score Is a Game-Changer
A high DRE is more than just a sign of technical skill; it protects your brand and your budget. The benefits are real and immediate.
- Happier Customers: Fewer bugs in production mean a smoother experience. A reliable product is key to keeping customers around.
- Lower Support Costs: Catching defects early means fewer support tickets, fewer angry calls, and less time spent on costly emergency patches.
- Increased Developer Velocity: Your team can stop fire-fighting and start building. Less time on hotfixes means more time creating value.
DRE really stands out as a critical health indicator for a development pipeline. Industry data suggests that escaped defects can plague 40-50% of releases in teams with weak testing practices. Back when manual testing was king, a DRE of 70-80% was considered pretty good. Today, with smart automation, top-tier teams are pushing that number to 90% or even higher. You can read more about these evolving standards in these software testing trends for 2025.
Boosting DRE with Modern Test Automation
So, how do you get that number up? The most impactful lever you can pull is building a comprehensive test automation suite. Manual testing will always have its place, but it can’t keep up with the sheer complexity of modern applications. There are just too many edge cases and user paths to cover by hand.
This is where AI-powered tools come into their own. They are brilliant at uncovering the subtle, tricky bugs that a human might miss after hours of repetitive testing. They can simulate thousands of unique user journeys or test against a dizzying array of device configurations without breaking a sweat.
Tools like TestDriver were built for exactly this challenge. They give teams the ability to generate complete end-to-end tests from simple, plain-English descriptions of what a feature should do. This massively speeds up the creation of test suites that cover the flows your users actually care about.
When you empower your developers and QA engineers to create more tests in less time, you shift your entire quality process from reactive to proactive. You find bugs earlier, when they’re cheap and easy to fix. That’s the secret to driving your DRE sky-high and building a quality culture that lasts.
How to Achieve Meaningful Test Automation Coverage
Let’s talk about one of the most misunderstood test metrics in testing: Test Automation Coverage. Too many teams get fixated on hitting that magic 100% number, treating it like a grade on a final exam. But this chase is more than just unrealistic—it’s often a recipe for disaster, leading to brittle tests that check trivial code while leaving critical user journeys completely exposed.
A high percentage doesn’t mean a thing if it isn’t reducing actual business risk. Instead of asking, “How much code did we cover?” we should be asking, “Are we testing the things that truly matter to our users and our business?”
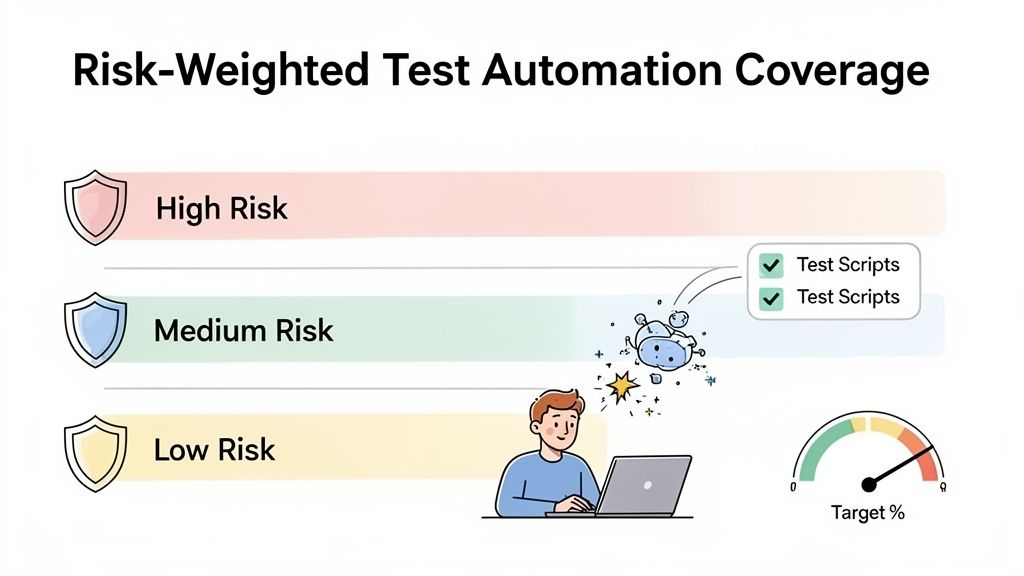
Adopting a Risk-Weighted Approach
The most effective engineering teams don’t see coverage as a simple percentage. They see it as a strategic tool for managing risk. A risk-weighted approach means you intentionally point your automation efforts where a failure would cause the most damage—to your revenue, your reputation, or your users’ trust.
Think of your application like a house. Aiming for 100% coverage is like trying to cram a smoke detector into every closet, drawer, and crawlspace. A risk-weighted approach, on the other hand, is about making sure you have the best detectors in the kitchen, near the furnace, and in every bedroom—the places a fire is most likely to start and cause real harm.
This shift in mindset helps you spend your most valuable resource—engineering time—where it counts.
Prioritizing Your Most Critical Paths
To get started, you first have to define what “high-risk” actually means for your product. The best way to do this is by mapping out your critical user journeys.
- E-commerce: What is the exact path from a customer adding an item to their cart to seeing that successful payment confirmation?
- SaaS: Can a new user sign up, create their first project, and invite a colleague without hitting a single snag?
- Healthcare: Is patient data kept secure at every step—from login and data entry to generating reports?
These are the non-negotiable flows that have to work, period. Your highest test automation coverage should be laser-focused right here. When you view it this way, Test Automation Coverage becomes a powerhouse metric, revealing how much of your most important functionality is protected.
Modern enterprise benchmarks for 2025 are targeting 70-80% coverage specifically for these high-risk paths. It’s a trend that’s catching on, with global adoption now at 77% among top companies. That’s a huge leap from 2020, when only 44% of teams were automating over half their tests. You can dig deeper into these software testing statistics and trends to see just how fast things are changing.
Your goal isn’t to test everything. It’s to ensure that your most important promises to your users are protected by a robust safety net of automated tests.
This approach transforms your test suite from a bloated list of checks into a lean, purposeful guardian of your core business value.
How AI Accelerates Meaningful Coverage
Building this kind of targeted coverage used to be a slow, painstaking process. Writing, debugging, and maintaining end-to-end tests for complex flows required niche skills and a huge time commitment. But this is where modern AI-driven tools are completely changing the game.
Imagine a QA engineer or developer simply describing a user flow in plain English, like “A user logs in, navigates to the dashboard, and verifies that their subscription status is active.” In a matter of minutes, an AI agent can take that prompt and generate a production-ready, executable end-to-end test that covers the entire journey.
This is a massive acceleration. Teams can now:
- Build comprehensive suites faster: You can cover all of your high-risk user journeys in a tiny fraction of the time it would have taken manually.
- Empower the whole team: Developers who aren’t automation experts can now easily contribute to the test suite, which helps build a stronger culture of quality ownership.
- Adapt to changes quickly: When a user flow is updated, creating a new test is as simple as tweaking a text prompt.
Platforms like TestDriver are leading this charge. By turning human intent into machine action, they make achieving meaningful, risk-weighted coverage a practical reality for any team, not just a theoretical best practice. This ensures your coverage metrics are a true reflection of product stability and user trust.
Putting Your Test Metrics Strategy into Action
All this theory is great, but the real magic happens when you turn these ideas into results. It’s time to stop just reading about test metrics in testing and start actually using them. This is your hands-on plan for weaving a solid metrics strategy right into your current workflow, without needing to rip everything apart and start over.
We’ll focus on a practical approach: connecting an AI-powered testing tool like TestDriver with a standard CI/CD pipeline, such as GitHub Actions. The idea is to automate both your test runs and your data collection from the very beginning. This way, you can start making smarter, data-driven decisions about quality almost immediately.
Step 1: Generate Your First AI-Powered Test
First things first, you need a test. Let’s start with one that covers a critical user flow. With a tool like TestDriver, you don’t have to get bogged down in complex scripting. You can generate your first end-to-end test with a simple prompt.
For instance, just describe a user signup and login flow in plain English. The AI takes it from there, generating the code needed to check that this core piece of your application works. This one test is the seed from which your entire metrics program will grow.
Step 2: Integrate with Your CI Pipeline
With a test in hand, the next move is to get it running automatically. Kicking off tests by hand just isn’t reliable or scalable. By plugging it into your CI/CD pipeline, you guarantee it runs on every single pull request or commit to your main branch.
This creates a steady, automated feedback loop. Every time code changes, it’s instantly checked against that critical user flow, and the results—pass or fail—are logged without anyone lifting a finger. This constant validation is the engine that drives your whole metrics strategy, feeding you a nonstop stream of data. For teams managing this process, having the right tools is key. To get a better sense of this, check out our guide on how to effectively track QA metrics using Jira.
Step 3: Set Up Webhooks and Dashboards
Okay, your tests are running automatically. The final piece is making that data visible and useful. This is where webhooks are your best friend. Set up your testing platform to fire off the results of each test run to a monitoring tool or even a simple data warehouse.
A metric that isn’t seen is a metric that doesn’t exist. The goal is to pipe your raw test data into a simple dashboard that visualizes your most important numbers: Test Pass Rate, Execution Time, and Flakiness.
From that data stream, you can build a simple but powerful dashboard to track your most important metrics from day one. Suddenly, you can see trends, spot problems, and have real conversations about quality backed by actual data. And while you’re focused on internal metrics, don’t forget the outside world. Exploring different methods for customer feedback collection can give you invaluable qualitative insights that pair perfectly with your hard test data.
This three-step process—generate, integrate, and visualize—is all it takes to get your strategy off the ground.
Frequently Asked Questions About Test Metrics
Which Test Metric Should We Focus on First?
When you’re just starting to track test metrics, it’s easy to get overwhelmed. My advice is always to begin with two: the Test Pass Rate and the Defect Escape Rate. Think of the Test Pass Rate as the immediate pulse check on your build’s health right inside your CI/CD pipeline.
If that rate drops, you have an instant, unambiguous signal that something’s broken. At the other end of the spectrum, the Defect Escape Rate tells you what your customers are experiencing. It’s a direct measure of your entire QA process’s effectiveness and the quality of what you’re shipping. These two give you the most bang for your buck right out of the gate.
How Can Our Team Avoid Getting Sidetracked by Vanity Metrics?
This is a classic trap. The best way to steer clear of vanity metrics is to relentlessly connect every metric back to a real business outcome. For instance, chasing 100% test coverage sounds impressive, but it’s often a meaningless goal. A much smarter approach is to focus on covering the critical user journeys that directly affect revenue or user satisfaction.
Ask your team this one simple question: “If we improve this number, does it result in a better product, faster releases, or lower costs?” If the answer isn’t a clear “yes,” you might be looking at a vanity metric. Keep your focus on metrics with real teeth, like Defect Escape Rate, MTTR, and Testing ROI.
How Often Should We Be Looking at Our Test Metrics?
It really depends on the metric. Your frontline, operational metrics—things like Test Pass Rate and Test Execution Time—demand real-time attention. These should live on automated dashboards where your team can see them constantly, with alerts set up for any major deviations.
For the more strategic metrics, like Defect Escape Rate or trends in Test Coverage, a weekly or bi-weekly review is perfect. Folding this discussion into your regular team retrospectives is a great way to spot longer-term patterns and make meaningful tweaks to your process without getting lost in the day-to-day noise.
Ready to stop guessing and start measuring? TestDriver helps you generate end-to-end tests from simple prompts, making it easier than ever to gather the data you need to ship with confidence. Start building a data-driven QA strategy today.
Automate and scale manual testing with AI
TestDriver uses computer-use AI to test any app - write tests in plain English and run them anywhere.