How to Create a Test Case: how to create test case that actually finds bugs
Discover how to create test case strategies that catch bugs early. This guide covers templates, real-world examples, and AI-powered QA.
A complete guide to test reports in software testing. Learn to create actionable reports that drive quality, inform stakeholders, and improve your QA process.
Automate and scale manual testing with AI ->
In the world of software testing, a test report is the single most important document you’ll produce. It’s the official record of all your testing efforts, detailing the activities, the results, and, ultimately, the overall health of the software. But it’s much more than a simple log of data. A good report turns raw testing results into clear, actionable insights, guiding the critical go/no-go decision for a release.

It helps to think of a test report as a medical chart for your application. When you get a health check-up, the doctor doesn’t just hand you a list of numbers. They interpret your vital signs to give you a complete picture of your health, track progress over time, and recommend what to do next.
That’s exactly what a great test report does. It moves beyond just counting “passed” or “failed” tests and provides a comprehensive health assessment of the software. This “medical chart” translates complex technical data into a story that different people—your stakeholders—can easily understand and use to make smart decisions.
A single test report often has to speak to several different audiences at once, and each one is looking for something specific. A truly effective report is structured to deliver value to everyone, from the engineers in the trenches to the executives in the boardroom.
A great test report is the cornerstone of a data-driven development process. It transforms subjective opinions about quality into objective evidence, ensuring that decisions are based on facts, not guesswork.
The pressure to deliver high-quality software has never been greater, and that means robust testing—and the clear reporting that comes with it—is a business imperative. The software testing industry, valued at $48.17 billion in 2025, is on track to nearly double by 2030. This explosive growth underscores just how critical effective testing has become.
At the end of the day, reporting isn’t just about cataloging bugs; it’s about building confidence across the entire team. By gathering and presenting the right data in the right way, you validate all the hard work that went into the development cycle. To learn more about this crucial first step, take a look at our guide on effective strategies for collecting testing evidence.
Ultimately, the test report is the final chapter of a development story, telling everyone involved exactly where the software stands and what needs to happen next.

A great test report is far more than a dry list of passed and failed tests. It’s a story about the software’s quality, told in a way that different people can understand. Think of it like a mechanic’s diagnostic report for a car—some people just want to know if it’s safe to drive, while others need to see the specific part numbers and torque settings to fix the engine.
Each section of the report serves a distinct purpose for a specific audience. The executive summary is for the manager who needs the “all clear” before a release. The deep-dive defect details, on the other hand, are for the developer who has to roll up their sleeves and start squashing bugs.
Your job as a QA professional is to build this report so everyone gets exactly the information they need, without having to dig through irrelevant details. It’s about clarity, context, and communication.
To build a report that actually gets read and acted upon, you need to include a few key ingredients. These components work together to paint a complete picture of the testing cycle, leaving no room for ambiguity. A well-built report ensures that critical findings don’t get lost as information moves between teams.
Over the years, the best test reports in software testing have always focused on four main pillars: easy-to-read charts, crucial performance metrics, comparisons against previous builds, and clear, actionable advice for fixing what’s broken. These elements are the bedrock of communicating quality, whether you’re talking to a fellow engineer or a C-level executive.
So, what absolutely has to be in there?
Knowing who you’re writing for is half the battle. A project manager has different needs than a developer, and your report structure should reflect that. The table below shows how different parts of the report cater to specific team members.
A well-structured report ensures every stakeholder can quickly find the information relevant to their role, making the entire process more efficient.
| Component | Purpose | Primary Audience |
|---|---|---|
| Executive Summary | Provides a quick, high-level overview and a go/no-go recommendation. | Executives, Project Managers |
| Test Scope | Defines the boundaries and goals of the testing cycle. | QA Leads, Product Managers |
| KPIs & Metrics | Shows the overall health and progress of the software quality. | Project Managers, QA Managers |
| Defect Details | Gives specific, actionable information for debugging and fixing issues. | Developers, QA Engineers |
| Recommendations | Guides the next steps and prioritizes follow-up actions. | All Stakeholders |
By including these essential elements, you transform your test report from a simple data dump into a powerful tool that drives decision-making. If you want to get even more granular on a key part of this process, check out our guide on how to effectively document your automated test coverage.
Test reports aren’t a one-size-fits-all deal. Think of it like a photographer switching lenses for different shots—you need the right report to frame your testing results for a specific audience and purpose. Sending a project manager the raw logs of a failed API call is like using a macro lens for a landscape photo. It’s just too much detail when what they really need is the big picture.
The secret to effective communication is matching the report’s “focal length” to your audience’s needs. A C-level executive wants a crisp, panoramic summary of the project’s health, but a developer needs a microscopic look at a single bug. Choosing the wrong type of test reports in software testing just leads to confusion, wasted time, and valuable insights getting lost in the noise.
Let’s break down the main types of reports so you can pick the perfect one every time.
This is your “wide-angle lens.” The summary report gives a sweeping overview of the entire testing cycle, and it’s built for executives, project managers, and other non-technical stakeholders. Its whole job is to answer one critical question: “Are we ready to ship this thing?”
This report steers clear of technical jargon and boils everything down to the KPIs that signal overall project health.
The goal here is a quick, digestible snapshot. Anyone should be able to read it and make a confident decision in under five minutes.
Now we’re switching to a “standard lens.” The detailed test report offers a much closer, more granular look at what happened during testing. This is the daily driver for your core technical team—QA engineers, developers, and QA leads. It provides the hard evidence needed to understand exactly what went down during test execution.
While it includes the summary metrics, its real value is in the nitty-gritty details.
A detailed report is the ground truth for your technical team. It’s not just about saying a test failed; it’s about providing the full story—the why, where, and how—so a developer can reproduce and fix the issue without a painful back-and-forth.
This report meticulously documents every step, from environment configurations and test data to the actual vs. expected results. For certain projects, like those involving security, understanding the specific outputs from various penetration testing tools and their reports is crucial for creating a truly comprehensive detailed report.
Time to zoom all the way in with the “macro lens.” A defect-centric report filters out everything else and focuses exclusively on the bugs. This is an indispensable tool for bug triage meetings, where teams have to decide which problems to tackle first. It cuts through the noise of passed tests and presents a clear, actionable list of what’s broken.
You’ll typically see these key elements:
This report is what drives the debugging process forward. It helps teams organize their efforts and systematically knock out issues based on what matters most to the business.
Finally, let’s look at the “time-lapse” view. A trend analysis report isn’t about a single test cycle; it’s about connecting the dots over multiple cycles. By pulling data from test runs over several weeks, sprints, or even months, this report reveals powerful patterns in your software quality.
It helps managers and leads answer strategic questions, such as:
This historical perspective is priceless for process improvement. It helps you spot recurring problem areas and actually measure whether your quality initiatives are making a difference.
Trying to write test reports by hand in a modern development cycle is like trying to develop film in a darkroom. It’s slow, it happens way too late, and the picture is often outdated by the time anyone sees it. In a world where speed is everything, that kind of delay is a massive bottleneck. The only real solution is to stop treating reporting as a manual chore and start treating it as an automated, real-time process baked right into your CI/CD pipeline.
When you integrate report generation directly into your pipeline, you transform it from a static, historical document into a dynamic, live feedback loop. Instead of waiting for a QA engineer to painstakingly compile results, your team gets an immediate, unfiltered look at the health of every single build. This is a foundational shift for any team serious about DevOps, where quality becomes a shared responsibility and feedback is instant.
The biggest win from automating test reports in software testing within a CI/CD pipeline is pure speed. A developer commits their code, the pipeline kicks off a build, runs all the automated tests, and generates a report right then and there. If something breaks, the developer knows about it in minutes, not hours or days.
This immediacy shrinks debugging cycles from a marathon to a sprint. Developers can jump on issues while the code and context are still fresh in their minds, which stops small bugs from snowballing into complex, tangled problems later on. This rapid feedback is what keeps development momentum going and ensures quality is an ongoing ingredient, not a final inspection.
This isn’t just a niche practice anymore; it’s quickly becoming the standard. The move toward automated test reporting is one of the defining trends in software quality. In fact, studies show that 77% of companies have already adopted automated software testing, and many are now using automated reporting tools to boost efficiency. This not only cuts down on human error but also closes the gap between running a test and getting actionable feedback. If you’re curious about the data behind this shift, you can dig into the latest test automation statistics.
To make this happen, you need the right tools that can plug directly into your CI/CD environment. Think of CI servers like Jenkins, GitLab CI, or GitHub Actions as the engines, while various testing frameworks and reporting libraries are the components that produce the actual output.
Here are a few common setups:
Integrating reporting into your CI/CD pipeline is the difference between reading yesterday’s newspaper and watching a live news broadcast. One tells you what happened; the other shows you what’s happening right now, so you can actually do something about it.
Automating your test reports does more than just save a few hours. It fundamentally changes how your team thinks about quality. When test results are splashed across a shared dashboard for everyone to see, quality stops being an abstract concept and becomes a transparent, collective goal. A failing build is no longer just a “QA problem”—it’s an all-hands-on-deck signal that needs immediate attention.
This shared visibility naturally fosters better collaboration between developers and QA engineers, breaking down the old silos and encouraging a more proactive mindset. For teams ready to make this leap, understanding the best practices for integrating testing into your CI/CD pipeline is the perfect next step.
Ultimately, by embedding reporting into your automated workflows, you turn a boring documentation task into an active, strategic tool. It provides the real-time data your team needs to build better software, faster—which is the entire point of CI/CD in the first place. Your test report becomes a living dashboard that guides development, not a historical archive that just gathers dust.
A great report does more than just present data; it tells a compelling story about your software’s quality. It’s the critical bridge between raw test execution results and smart, informed business decisions. To create reports that people actually read and act on, you need a thoughtful approach—one that’s built on clarity, context, and communication.
It’s tempting to just dump every metric into a document and call it a day, but that’s not a report; it’s a data log. An effective report is insightful, tailored to its audience, and designed to drive real action. By following a few key best practices, you can turn your reports into powerful tools that guide your entire development process.
This is the golden rule of reporting: always know who you’re writing for. A C-level executive doesn’t care about the stack trace of a failed test, and a developer needs much more than a high-level pass/fail percentage. You have to tailor the content and complexity to meet the specific needs of each stakeholder.
Always use clear, concise language and steer clear of technical jargon, especially when communicating with non-technical stakeholders. If a report is a pain to read, its insights will get lost.
This diagram shows how a modern, automated reporting process flows from a code change all the way to actionable insights, giving the team real-time feedback.
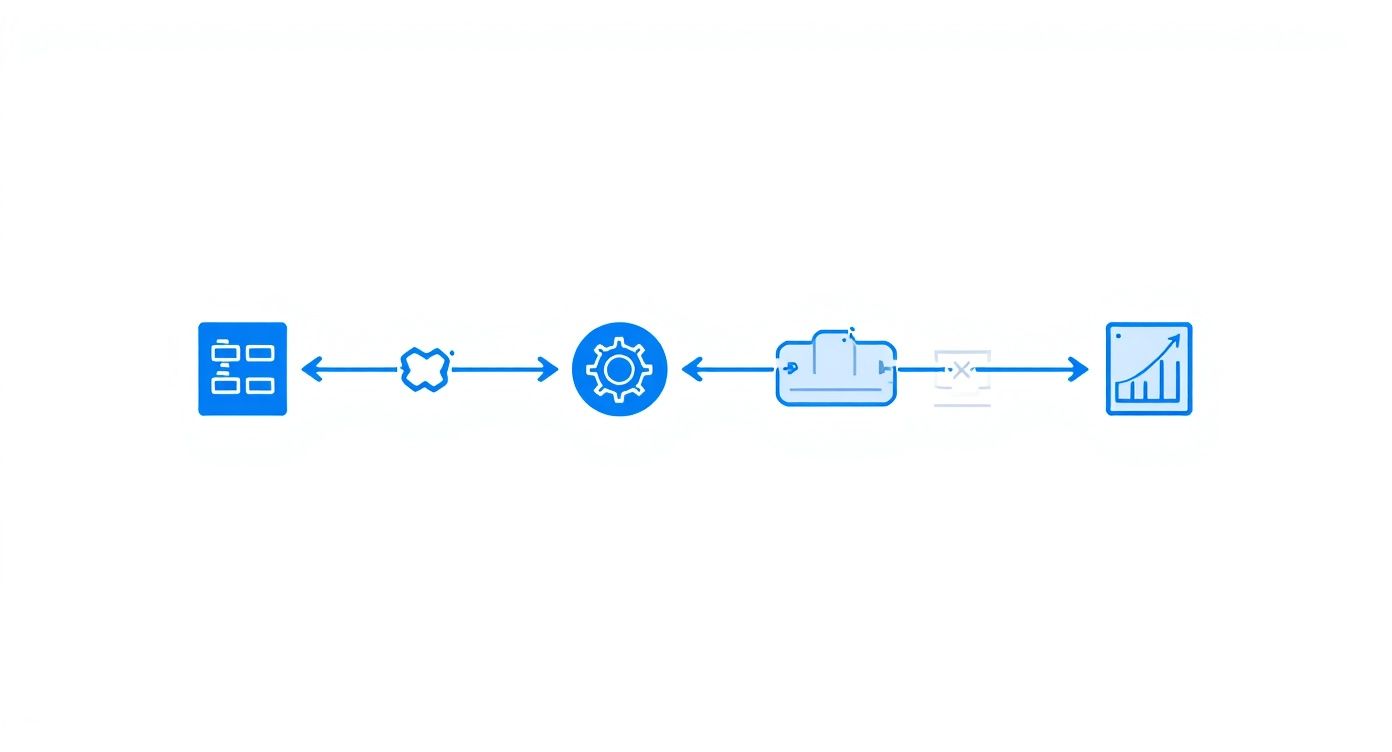
By weaving testing and reporting directly into the build pipeline, teams make sure that quality feedback is immediate and continuous—not some delayed, manual step at the end.
Raw numbers on their own are meaningless. It’s your job to connect the dots and explain what the data actually means. Instead of just stating that 75% of tests passed, dig deeper. Is that an improvement from the last build? Does the 25% failure rate contain critical, release-blocking bugs?
The best reports don’t just present data; they provide analysis. They answer the “so what?” question for stakeholders, turning metrics into meaningful insights that guide the next steps.
Visuals are your best friend here. Charts and graphs can communicate trends and highlight anomalies far more effectively than a dense table of numbers ever could. To make your reports truly pop, you can even learn how to build amazing, interactive reports.
A report that doesn’t lead to action is a wasted effort. Simple as that. Every report should wrap up with clear, specific, and actionable recommendations. Don’t just list the problems you found; suggest a path forward.
For example, instead of saying, “Many performance tests failed,” be precise: “The API response time under load increased by 30%, exceeding our SLA. We recommend the backend team prioritize investigating the user-profile endpoint.” That gives the team a clear starting point and a sense of ownership.
Even with the best intentions, it’s easy to make mistakes that completely undermine a report’s impact. Knowing what these common pitfalls are is the first step to avoiding them.
The table below contrasts frequent reporting errors with the best practices that ensure your message lands loud and clear.
| Common Pitfall | Best Practice Solution |
|---|---|
| Data Overload | Focus on 3-5 key metrics that align with project goals and what your audience actually cares about. |
| Lack of Context | Compare current results to previous builds or baselines to show trends and progress over time. |
| Vague Language | Use specific, objective language. Provide direct links to defects and logs so there’s no ambiguity. |
| No Clear Takeaway | Start with a concise executive summary and end with concrete, actionable recommendations. |
| One-Size-Fits-All Format | Create different report versions or dashboards tailored to technical and non-technical audiences. |
By sticking to these best practices, you ensure your test reports aren’t just read but are actively used to improve software quality, streamline development, and build confidence across the entire organization. Your report becomes the definitive voice on product health, guiding everyone toward a successful release.
Even when you know the ropes, putting test reporting into practice can bring up a lot of questions. Getting these details right is what separates a report that gets filed away from one that actually drives decisions.
Let’s tackle some of the most common questions that pop up when teams are building out their QA reporting process.
This is a big one, and it’s a classic case of “know your audience.” Think of it like a movie review versus the entire screenplay.
A test summary report is the movie review. It’s a high-level overview built for people who need the bottom line, fast—project managers, executives, and other business stakeholders. It skips the nitty-gritty details to give a quick snapshot of the software’s health and, most importantly, a clear go/no-go recommendation. It answers the question, “Are we good to release?”
On the other hand, a detailed test report is the full screenplay. It’s packed with granular data for the technical crew: developers, QA engineers, and test leads. It digs into every test case, complete with environment specs, logs, and screenshots. Its job is to answer, “What broke, where did it break, and how do we fix it?”
If you’re working in an Agile or DevOps environment, reporting has to keep up with the pace of development. The old-school approach of dropping a huge report at the very end of a testing cycle just doesn’t work anymore. Reporting should be a continuous pulse, not a final post-mortem.
The gold standard? A report should be generated automatically with every single build that runs through the CI/CD pipeline. This gives developers immediate feedback, letting them spot and squash bugs in minutes, not days.
But for your stakeholders, the rhythm is a bit different:
In Agile, the goal of reporting is instant visibility, not just end-of-phase paperwork.
Every project has its own quirks, but a few core metrics are almost always essential for telling a clear story about your software’s quality. The key is to pick just a handful that matter most—trying to track everything is a surefire way to create a report no one will read.
Here are the heavy hitters you should almost always consider:
A great rule of thumb is to focus on 3-5 key metrics that directly map to your quality goals. This keeps your report focused, actionable, and free from the “analysis paralysis” that comes from information overload.
Of course! A killer test summary report is all about being concise and scannable. It has to get the crucial information across quickly so busy stakeholders can make a call without getting bogged down in the weeds.
Here’s a simple but effective structure you can use as a starting point:
Project Name: [e.g., Phoenix Project]
Build/Version Number: [e.g., v2.5.1]
Test Cycle Dates: [Start Date] - [End Date]
The Bottom Line:
A quick paragraph (just 2-3 sentences) summing up the results and giving a direct Go/No-Go recommendation.
What We Tested (And What We Didn’t):
In Scope: A brief list of the features or user stories covered in this cycle.
Out of Scope: Clearly state any important features that were not tested.
Key Metrics at a Glance (Use Visuals!):
A pie chart showing the Test Case Pass/Fail/Blocked Rate.
A bar chart visualizing the Defect Status (e.g., Open, In Progress, Closed).
Showstoppers:
A short, bulleted list of any open blocker or critical bugs, with links to your bug tracker for more details.
Risks & Next Steps:
Point out any risks to the release and suggest clear, actionable recommendations for the team.
This format ensures your report is valuable enough to be informative but simple enough to be understood in just a few minutes.
Ready to stop wrestling with manual test creation and reporting? TestDriver uses AI to help you generate end-to-end tests from simple prompts, letting you focus on quality instead of scripting. See how you can accelerate your QA process at https://testdriver.ai.
Discover how to create test case strategies that catch bugs early. This guide covers templates, real-world examples, and AI-powered QA.
Discover how automated testing DevOps transforms your CI/CD pipeline. This guide covers practical strategies, tools, and AI's role in accelerating releases.
Discover the 12 best codeless automation testing tools for web, API, and mobile. Our 2026 guide helps you choose the right platform for your QA workflow.
Discover how to generate test cases automatically using AI. This practical guide covers effective prompts, CI/CD integration, and real-world QA strategies.
TestDriver uses computer-use AI to test any app - write tests in plain English and run them anywhere.