Mastering testing website in different browsers: A Practical Guide
Learn how to master testing website in different browsers with practical strategies, automation tips, and real-world debugging insights.
Automate and scale manual testing with AI ->
So, what exactly does it mean to test a website in different browsers? It’s the process of making sure your web application looks and works as intended for everyone, whether they’re using Chrome, Safari, Firefox, or something else. This isn’t just a box-ticking exercise. Every browser interprets code a little differently, and those small differences can lead to major bugs that frustrate users and hurt your business.
Why Browser Inconsistencies Can Break Your Website
It’s tempting to assume your website will “just works” everywhere, but that’s a risky bet. We need to look past the idea that testing is just a technical chore and focus on what really happens when your site breaks for a user on Safari or an older version of Chrome.
Think about it: a single CSS bug isn’t just a visual glitch. It could be the thing that makes your “Buy Now” button completely unusable, causing your conversion rates to plummet overnight. Likewise, a JavaScript error that only shows up on Firefox might stop your signup form from working, flooding your support channels with tickets from annoyed users. These aren’t minor issues—they’re critical business problems that erode trust and damage your brand.
The Real-World Business Impact
The fallout from a poor user experience is both severe and immediate. When things don’t work, people don’t stick around. A 2022 Adobe study put a number on it: a staggering 88% of users are less likely to return to a website after just one bad experience. That makes browser compatibility failures potentially catastrophic.
This is especially true as browsers continue to implement web standards in their own unique ways, creating gaps that directly impact the user. You can find more insights about this trend and its impact in our analysis here on Qase.io.
A website that works well across different browsers isn’t a feature—it’s a baseline expectation. Failing to meet it tells your customers that you don’t value their experience, sending them straight to your competitors.
Seen this way, testing your website in different browsers stops being a developer’s task and becomes an essential practice for protecting your revenue.
Key Areas Prone to Cross-Browser Issues
To get started with cross-browser testing effectively, it helps to know where the problems usually hide. Certain technical areas are notorious for causing headaches because of how differently browsers handle them. By focusing your initial efforts here, you can save a ton of time and squash the most common user-facing bugs first.
Below is a quick rundown of the usual suspects.
| Technical Area | Common Issues | Example Browsers Affected |
|---|---|---|
| CSS Layout | Flexbox/Grid alignment bugs, incorrect element spacing, broken responsive breakpoints. | Safari, Older Firefox Versions |
| JavaScript APIs | Inconsistent support for modern APIs (e.g., Fetch, Promises), date/time handling. | Internet Explorer (legacy), Safari |
| HTML5 Features | Varies support for video/audio tags, form input types, and canvas rendering. | Older versions of any major browser |
| Font Rendering | Differences in font weight, anti-aliasing, and character spacing that affect UI clarity. | Chrome on Windows vs. macOS |
Keep these trouble spots in mind as you build your testing plan. They’re often the source of those “it works on my machine” mysteries that can derail a project.
Use Real User Data to Build Your Browser Matrix
Let’s get one thing straight: guesswork has no place in a serious cross-browser testing strategy. The whole process should start with a simple, data-backed question: who is actually using your website? Building a browser matrix—your checklist of browsers, devices, and operating systems to test—is about precision, not throwing darts at a board.
Your best friend here is your analytics platform. Whether it’s Google Analytics or something else, it holds the key. Dive into the audience and technology reports to see exactly which browsers, operating systems, and even screen resolutions your real-world users have. This data lets you stop worrying about generic market share stats and start focusing your energy where it’ll make a real difference to your customers.
Figure Out What Your Audience is Actually Using
First things first, look at your top browsers and their versions. You’ll probably discover that the vast majority—maybe even 90% of your audience—is on the latest versions of Chrome, Safari, and Firefox. Right away, you know where to point the bulk of your testing resources.
But don’t just scratch the surface. You need to dig a little deeper to find the really useful insights:
- Operating Systems: What’s the split between Windows, macOS, iOS, and Android? Sometimes a bug will pop up on Chrome for Windows but be totally fine on a Mac. This detail matters.
- Screen Resolutions: Pinpoint the most common viewport sizes. This tells you exactly which responsive breakpoints need to be rock-solid to prevent broken layouts.
- Device Categories: Are most of your users on desktop, mobile, or tablet? If your mobile traffic is huge, your testing plan better reflect that.
This analysis is the bedrock of your browser matrix. It takes you from a vague, overwhelming goal like “test everywhere” to a focused, manageable plan built around your actual users. It’s the difference between testing blindly and testing with purpose.
This is critical because even a small code change can introduce a bug on a specific browser, which ultimately impacts your business.
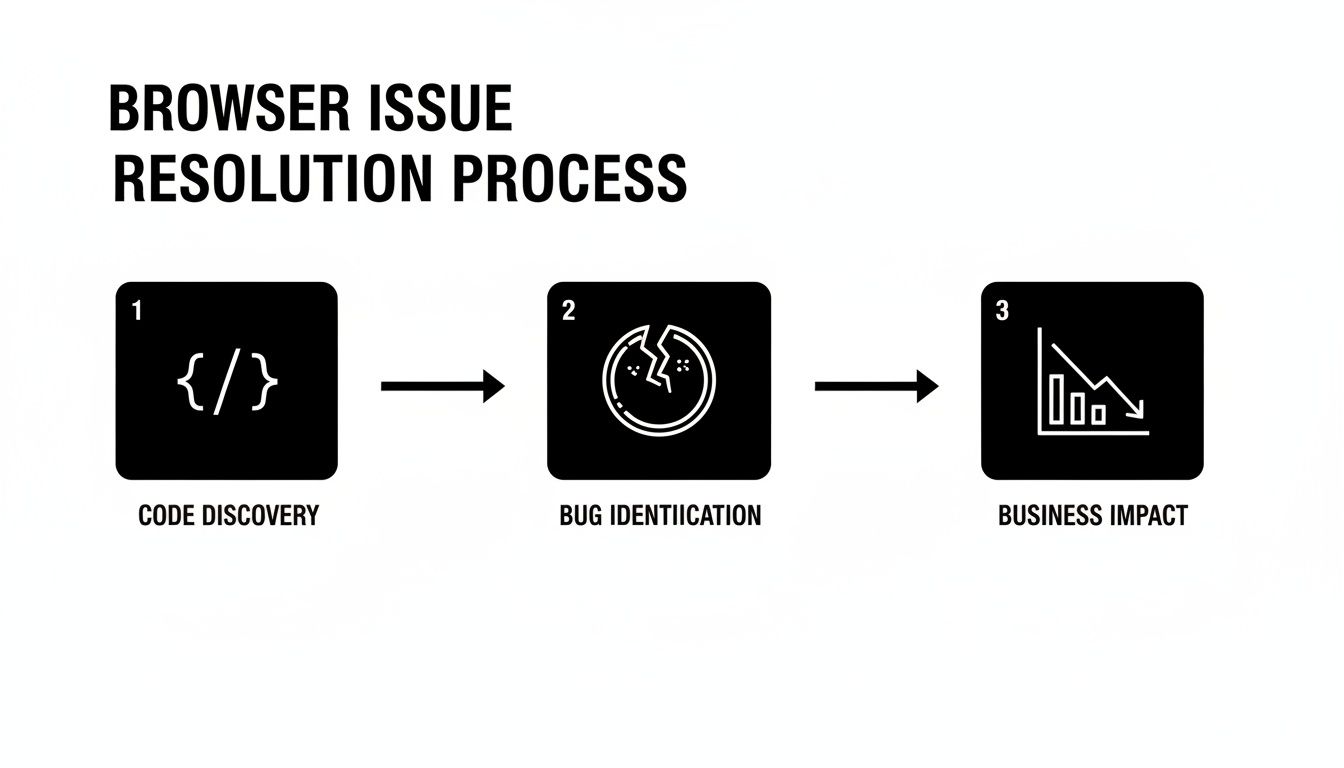
As the diagram shows, a compatibility issue isn’t just a technical headache; it’s a direct path to frustrating users and hurting your bottom line.
Prioritize for Maximum Impact
Okay, so you have the data. But trying to cover 100% of every browser version out there is a recipe for burnout. It’s just not practical. This is where smart prioritization comes in. Your job is to strike a balance between providing great coverage and not overwhelming your team.
Take Chrome, for example. In 2025, it commands around 65% of the desktop browser market share. But just “testing on Chrome” isn’t nearly specific enough. A look at the data from March 2023 to March 2024 shows that individual versions like Chrome 114 and 115 were, on their own, more popular than the entire Safari browser. That’s a powerful reminder to test specific, popular versions, not just the brand name. To really get this right, you should be digging into the latest browser market share trends.
A Pro Tip: Your browser matrix isn’t a one-and-done document. Think of it as a living guide. You should be hopping back into your analytics every quarter to make sure your testing priorities still line up with how people are actually using your site.
A tiered approach works wonders here. Group your configurations into priorities:
- Tier 1: Your top 3-5 browser/OS combinations that cover the lion’s share of your users (say, 80-90%). These get the full treatment—thorough manual and automated testing for every single release. No exceptions.
- Tier 2: Less common but still important segments. These might get a solid round of regression testing to catch any obvious breaks.
- Tier 3: Older, niche browsers. Maybe these only get a quick check for major feature launches.
This kind of tiered system ensures your most important users always get a flawless experience, all without stretching your team and resources too thin.
Choosing Between Manual and Automated Testing
When you’re tackling cross-browser testing, the big question always comes up: should we go manual or automated? People often talk about it like it’s a binary choice, but from my experience, the best teams don’t pick a side. They build a smart, hybrid approach that plays to the strengths of both.
Manual testing is all about the human touch. It’s where your QA engineer can act like a real user, clicking around, exploring, and uncovering those subtle UI and UX quirks that a script would just fly past. Think about a slightly misaligned button, a clunky animation, or a user flow that just feels… off. These are human problems, and you need a human to find them.
The Power of Human Intuition
This is precisely why manual checks are perfect for brand-new features that are still evolving. It’s almost always faster to have a person validate a new design than to write and debug an automation script for something that might completely change next week.
Here’s where manual testing really proves its worth:
- Exploratory Testing: Just using the application like a curious user to see what breaks.
- Usability Checks: Getting a gut feel for whether the site is intuitive and easy to use.
- Complex Scenarios: Walking through intricate user journeys that are just too brittle or complicated to automate reliably.
- Ad-Hoc Testing: Quickly checking a bug fix or a small tweak without the overhead of scripting.
Scaling Your Efforts with Automation
On the flip side, automation is your workhorse. Its superpower is handling repetitive, mind-numbing tasks with incredible speed and consistency. The classic example is regression testing—making sure your latest code changes didn’t accidentally break something important. No human wants to do that all day, and no human can do it as well as a machine.
The sheer variety of browsers out there has made automation a necessity. As of 2025, Chrome dominates the desktop market with 65%, but you still have Edge at 13%, Safari at 10%, and Firefox at 6%. Manually testing across all of those—plus their different versions—is a recipe for burnout. Automation is what makes broad coverage practical. It also allows you to plug testing directly into your CI/CD pipeline, making quality assurance a natural part of every build.
The right automation strategy doesn’t replace QA engineers; it empowers them. By automating the repetitive regression suite, you free up your team to focus on high-value, creative problem-solving and exploratory testing.
Manual vs. Automated Testing: When to Use Each
So, how do you decide what to automate and what to leave for manual review? It really comes down to your project’s needs, your team’s skills, and your release cadence. This table breaks down the sweet spots for each approach.
| Testing Aspect | Best for Manual Testing | Best for Automated Testing |
|---|---|---|
| Test Type | Usability, exploratory, and ad-hoc checks. | Regression, performance, and data-driven tests. |
| Frequency | One-off tests for new, unstable features. | Repetitive tests run frequently (e.g., on every code commit). |
| Goal | Find subtle UX flaws and “feel” issues. | Verify core functionality at scale and speed. |
| ROI | High for subjective, nuanced feedback. | High for stable, critical user journeys. |
Ultimately, blending both methods gives you the best of both worlds. The first step in building your automation suite is picking the right tool for the job. Frameworks like Playwright and Cypress have different philosophies and strengths, so it’s worth doing your homework. For a deep dive, check out our guide on choosing between Playwright and Cypress.
As you build out your plan, looking into proven software test automation strategies can help ensure you’re set up for success. By combining sharp human insight with relentless automated precision, you’ll create a robust testing process that catches more bugs and delivers a much better product.
Alright, you’ve done the planning and built your browser matrix. Now for the fun part: running an actual test and seeing it all come together. We’re going to walk through how to execute a real end-to-end test, moving from a simple idea to a script that runs across multiple browsers.
Let’s simulate a critical user journey—the kind that makes or breaks a business—like logging in and adding an item to a shopping cart. The goal here isn’t to get bogged down in complex code. Instead, we’ll see how modern tools can turn a simple sentence into a powerful automated test.
Generating Your First Test With a Simple Prompt
Modern testing has changed. You don’t always have to be a coding guru to write effective tests anymore. With a platform like TestDriver, you can describe what you want to test in plain English, and it handles the heavy lifting of generating the test script.
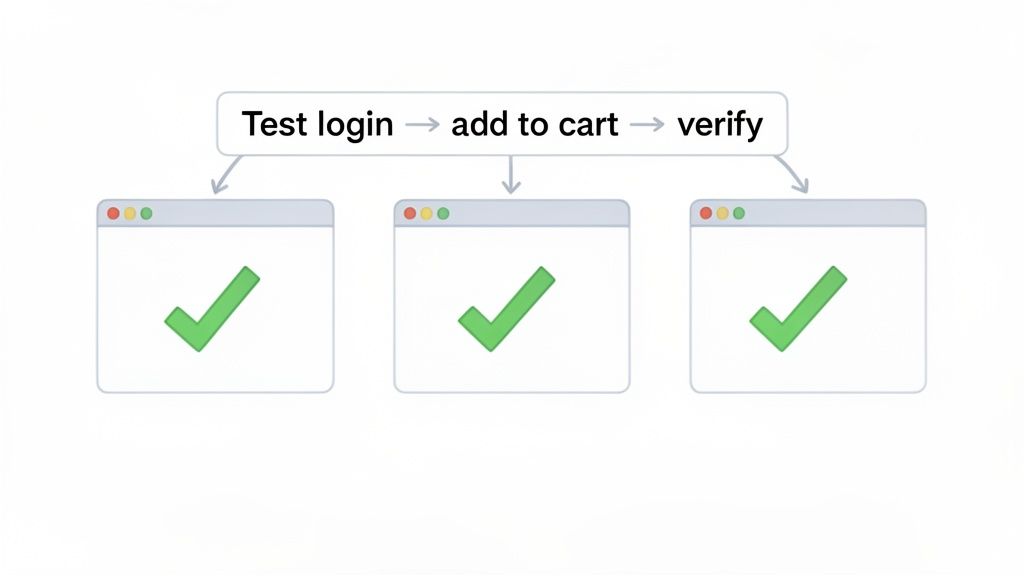
Let’s stick with our e-commerce example. We need to make sure a customer can log in, find a product, and add it to their cart. We could phrase this as a simple prompt:
“Test the login flow using valid credentials, add the first available product to the cart, and then verify that the item appears in the cart summary.”
That one sentence is enough. An AI-powered tool can take that user story and translate it directly into an executable script, which is a massive time-saver compared to writing it all from scratch.
The generated code might look something like this (simplified for clarity):
// Test generated from prompt
test(‘Login, Add to Cart, and Verify’, async ({ page }) => {
// Step 1: Navigate to the login page and sign in
await page.goto(‘/login’);
await page.fill(‘#username’, ‘[email protected]’);
await page.fill(‘#password’, ‘SecurePassword123’);
await page.click(‘button[type=“submit”]’);
// Step 2: Add the first product to the cart await page.click(‘.product-item:first-child .add-to-cart-button’);
// Step 3: Go to the cart and verify the product is there
await page.goto(‘/cart’);
const cartItem = await page.locator(‘.cart-item-title’).textContent();
expect(cartItem).toContain(‘Name of First Product’);
});
See how readable that is? It follows our prompt exactly: it navigates, fills in fields, clicks buttons, and—most importantly—verifies the outcome.
Configuring the Test to Run Across Multiple Browsers
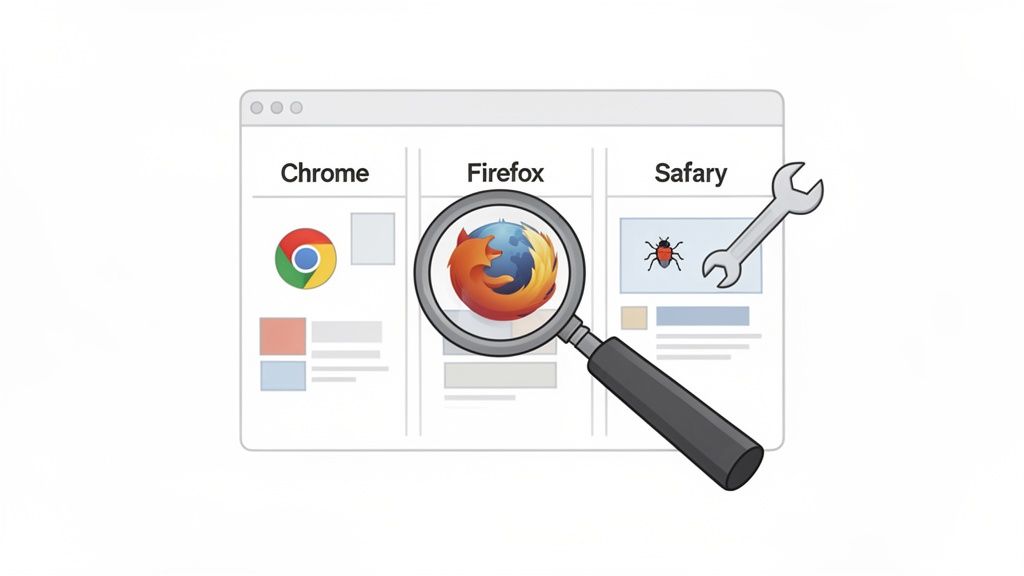
A test running on a single browser is a decent start, but the real magic happens when you unleash it across your entire browser matrix. This is how you find those sneaky, browser-specific bugs that drive users crazy.
Thankfully, setting this up is usually straightforward. Most modern test frameworks rely on a simple configuration file where you tell it which browsers to run against. You might set it up to target the latest stable versions of Chrome, Firefox, and Safari (WebKit).
Example Configuration:
- Target Browsers: List the browsers from your matrix (e.g., Chrome, Firefox, WebKit).
- Operating Systems: Specify different OS versions if that’s important (e.g., Windows 11, macOS Sonoma).
- Execution Mode: Choose whether to run tests headlessly (silently in the background) or with a visible browser window, which is great for debugging.
This config file tells the test runner to execute our login and cart script on each browser. It provides a direct, side-by-side comparison of how your website functions in different environments, all from a single test script.
The core principle of effective cross-browser testing is write once, run everywhere. Your test logic should be robust enough to work across different browser engines without modification, allowing you to focus on analyzing the results, not rewriting the tests.
Executing the Tests and Interpreting the Results
With your configuration in place, kicking off the test suite is usually just a single command in your terminal. As the tests run, you’ll see real-time output showing which tests are passing or failing on each browser.
A high-quality test report is your best friend here. It should give you:
- A Clear Summary: A quick overview of which browser and OS combinations passed or failed.
- Detailed Logs: Console output, network requests, and other data for each step. This is gold for debugging.
- Screenshots and Videos: Visual proof of what the browser looked like at the moment of failure.
Let’s say the test passes on Chrome and Firefox but fails on Safari. A good report would show you a screenshot where the “Add to Cart” button was missing or broken, and the logs might reveal a JavaScript error unique to WebKit. This is precisely the kind of insight you need to catch critical issues before they ever get to a real user.
When you’re dealing with dozens of browser and device combinations, running everything locally isn’t practical. That’s when integrating with a cloud testing platform becomes a game-changer. You can learn more about using a service like BrowserStack for effective testing to dramatically scale up your coverage.
Weaving Browser Tests into Your CI/CD Pipeline
Automated cross-browser tests are great, but they deliver the most bang for your buck when they run automatically, behind the scenes, every single time you change your code. Kicking off tests by hand is a decent start, but plugging them into a Continuous Integration/Continuous Deployment (CI/CD) pipeline creates a powerful safety net that stops broken code from ever slipping into production.
The concept is straightforward. Whenever a developer pushes a commit or opens a pull request, a whole chain of automated checks should fire off instantly. This process typically installs dependencies, builds the application, and—most importantly—runs your entire cross-browser test suite.
If a single test fails on Chrome, Safari, or any other browser in your matrix, the pipeline halts, blocking the merge. This moves testing from a chore you do every once in a while to a constant, always-on quality gate. It catches browser-specific bugs just minutes after they’re written, which makes them incredibly cheap and easy to fix.
Setting Up a CI/CD Workflow
Let’s walk through a real-world example using GitHub Actions, a very popular and easy-to-use CI/CD platform. You define the entire workflow in a YAML file that sits right in your project’s repository. This file is just a set of instructions telling GitHub what to do when new code appears.
For a typical website testing scenario, your workflow will have a few key jobs:
- Checkout Code: The first thing you always do is grab the latest version of your code from the repository.
- Install Dependencies: The CI environment needs all the packages and browser executables required to run your tests.
- Run Tests: This is where the action is. The workflow triggers your test command, which executes your scripts against all the browsers you’ve configured.
Here’s a simple workflow.yml file for GitHub Actions that shows this in practice. I’ve set it up to run your tests every time a new pull request is opened.
name: Cross-Browser E2E Tests
on:
pull_request:
branches: [ main ]jobs:
test:
runs-on: ubuntu-latest

steps:

- name: Checkout repository

uses: actions/checkout@v3-
name: Setup Node.js uses: actions/setup-node@v3 with: node-version: ‘18’
-
name: Install dependencies run: npm install
-
name: Install Playwright browsers run: npx playwright install —with-deps
-
name: Run Playwright tests run: npx playwright testWith a setup like this, every single change is automatically checked across your target browsers before it gets a chance to be merged.
Running Your Pipeline Like a Pro
Once you have a basic pipeline in place, you can start adding some smarter features to make it even more useful. A big one is handling sensitive info like API keys or login credentials. Never hardcode them. Instead, use environment variables or secrets. CI/CD platforms like GitHub Actions have built-in secrets management, so your test scripts stay clean and secure.
Another thing to think about is what happens when a test does fail. Your pipeline needs to give clear, helpful feedback.
A failed pipeline shouldn’t just be a red ‘X’. It should provide developers with immediate access to logs, screenshots, and video recordings of the failure. This context is what turns a failed build from a roadblock into a quick fix.
You can tell your CI/CD tool to automatically save test artifacts—like reports, screenshots, and videos—whenever a job fails. This gives developers everything they need to debug the problem without having to painstakingly reproduce it on their own machine.
On top of that, integrating notifications with tools like Slack can alert the team the second a build breaks, ensuring issues are tackled right away. For a deeper dive, check out our guide on the best practices for integrating testing into your CI/CD pipeline.
By making cross-browser testing a core part of your CI/CD workflow, you create a culture where quality is everyone’s job—and an automated one at that. It stops being an afterthought and becomes a fundamental part of how you ship software, giving your team the confidence to move fast without breaking things.
Debugging Common Cross-Browser Headaches
Let’s be real: even with the best testing strategy, bugs are going to happen. Finding an issue isn’t a failure—it’s just part of the job. This is where solid debugging skills really shine, turning a frustrating roadblock into a chance to make the product better.
Most of the time, these headaches come down to how different browser engines read your code. Something that looks pixel-perfect in Chrome’s Blink engine might completely fall apart in Safari’s WebKit or act strange in Firefox’s Gecko. These little inconsistencies are the root of almost every cross-browser bug you’ll encounter.
Unraveling CSS Layout Quirks
I can’t count the number of times I’ve seen CSS layout issues, especially with Flexbox and Grid. You build a beautifully aligned component, and then it looks like a total mess in an older version of Safari. This usually boils down to subtle differences in how browsers first implemented these modules or their reliance on vendor prefixes.
Your first move should always be to fire up the browser’s developer tools. Inspect the element that’s acting up in both the working and broken browsers. Side-by-side, compare the computed styles panel—this is often the fastest way to pinpoint the exact property causing the grief.
Keep an eye out for these common CSS culprits:
- Vendor Prefixes: That older Safari version might still need
-webkit-prefixes for some Flexbox properties you’re using. It’s an easy thing to forget. - Implicit Sizing: Browsers sometimes disagree on how to calculate the default size of a flex or grid item, which can lead to some really weird wrapping or overflow issues.
- Gaps and Alignment: Support for the
gapproperty in Flexbox is a relatively recent development. An older browser might just ignore it, causing your elements to smash together.
Taming Inconsistent JavaScript Behavior
JavaScript bugs can be trickier because they’re often invisible. A feature might run perfectly in Firefox but just silently die in Edge, all because of a slight difference in how they implement a specific browser API. I’ve seen this happen a lot with things like date/time formatting or newer APIs.
When you’re hunting down a JavaScript bug, console.log() is your best friend. Seriously. Use it to trace the execution flow and check the state of your variables in the browser where things are going wrong. And always, always check the browser’s console for error messages. They often point you straight to the line of code that’s causing the problem.
Pro Tip: If a feature is broken in just one browser, your first stop should be a resource like MDN Web Docs. A quick search will tell you if the API you’re using isn’t fully supported. If it’s not, you’ll likely need a “polyfill”—a small chunk of code that backfills the missing functionality for older browsers.
To get ahead of these problems, it pays to explore various effective quality assurance testing methods you can build right into your workflow.
Writing More Resilient Tests
Ultimately, the best way to deal with bugs is to prevent them in the first place. That’s where writing more resilient tests comes in. Instead of targeting selectors that are likely to change, like a CSS class, anchor your tests to attributes that are meant for testing, like data-testid.
Think about it: a test looking for a button with the class .btn-primary will break the second a designer decides to change that class name. But a test looking for a button with a data-testid="submit-login" attribute will keep working, because it isn’t tied to the visual styling. It’s a small change that makes your entire test suite so much more stable.
Maintaining your tests is just as critical as writing them. Make a habit of reviewing your test suite to prune outdated tests and refactor flaky or slow ones. A well-maintained test suite is an incredible asset; a neglected one just creates noise and frustration. Give your test code the same respect you give your application code.
Stop wasting time writing tests from scratch. TestDriver uses AI to generate comprehensive end-to-end tests from a simple prompt, helping your team expand coverage and catch bugs faster. Get started for free at https://testdriver.ai.
Automate and scale manual testing with AI
TestDriver uses computer-use AI to test any app - write tests in plain English and run them anywhere.